



Portföyler
Yeni Portföye Ekle

İzle
![]() hareket halinde
Uygulamadaki anlık bildirimler yoluyla gerçek zamanlı güncellemeler alın.

Uygulamayı Açı
Piyasa Değerine Göre En İyi Analiz Coin'ler
Analiz piyasa değeri bugün 1,34 Milyar dolardır ve son 24 saatte -3.7% oranında bir değişim olmuştur.
Vurgular
$1.344.826.985
Piyasa Değeri
3.6%

$122.770.635
24sa İşlem Hacmi


| # | Coin | Fiyat | 1sa | 24sa | 7g | 30g | 24 Saatlik Hacim | Piyasa Değeri | FDV | Market Cap / FDV | Son 7 Gün | ||
|---|---|---|---|---|---|---|---|---|---|---|---|---|---|
| 8624 |

AInalyst
AIN
|
$0,00002618 | 0.1% | 3.5% | 14.1% | 27.9% | $7,86 | $26.177,59 | $26.177,59 | 1.0 |

|
||
| 8656 |

Howl.fi
HOWL
|
$0,00002584 | 0.3% | 6.2% | 32.8% | 0.0% | $209,51 | $25.841,33 | $25.841,33 | 1.0 |
|
||
| 8762 |

Pentagon Pizza Watch
PPW
|
$0,00002487 | 0.0% | 2.0% | 20.4% | 24.1% | $74,12 | $24.870,47 | $24.870,47 | 1.0 |

|
||
| 8845 |

opensvm.com
SVMAI
|
$0,00002386 | 0.0% | 0.5% | 12.2% | 20.8% | $37,01 | $23.846,59 | $23.846,59 | 1.0 |

|
||
| 8977 |

Tradescoop by Virtuals
SCOOP
|
$0,00002268 | 0.0% | 25.5% | 25.5% | 27.0% | $31,60 | $22.682,43 | $22.682,43 | 1.0 |

|
||
| 9095 |

ReVault
RVAULT
|
$0.062170 | 0.3% | 0.9% | 18.3% | 24.6% | $1,25 | $21.702,21 | $21.702,21 | 1.0 |

|
||
| 9160 |

Helio
HELIO
|
$0,00002295 | 0.0% | 2.3% | 9.0% | 21.8% | $1,26 | $21.165,57 | $21.165,57 | 1.0 |

|
||
| 9166 |

Navigate
NVG8
|
$0,00008374 | 0.0% | 0.8% | 0.8% | 9.4% | $2,05 | $21.128,81 | $83.741,27 | 0.25231056655503403 |

|
||
| 9228 |

Velvet AI
VELAI
|
$0,00001865 | 0.0% | 5.3% | 9.5% | 15.4% | $8,80 | $20.608,59 | $20.608,59 | 1.0 |

|
||
| 9350 |

Hyperbot
BOT
|
$0,0001552 | 0.0% | 4.0% | 39.3% | 36.9% | $63,57 | $19.533,36 | $155.232 | 0.125833333 |

|
||
| 9480 |

gemxbt
GEMXBT
|
$0,00001930 | 0.0% | 3.6% | 17.0% | 26.1% | $23,39 | $18.327,51 | $18.327,51 | 1.0 |

|
||
| 9514 |

Melvin
MEL
|
$0,00001808 | 0.0% | 4.8% | 30.0% | 21.0% | $2,13 | $18.081,20 | $18.081,20 | 1.0 |

|
||
| 9618 |

Mind AI
MA
|
$0,00003847 | 0.0% | 0.5% | 5.4% | 41.7% | $1.146,19 | $17.432,36 | $19.234,29 | 0.9063165495639125 |

|
||
| 9792 |

UpScalp
UPSCALP
|
$0,00001804 | 0.0% | 4.7% | 9.6% | 28.8% | $38,92 | $16.177,37 | $18.035,27 | 0.8969851681456671 |

|
||
| 9801 |

Prometheus
PROMETHEUS
|
$0,00003217 | 0.0% | 25.3% | 25.3% | 5.7% | $5,78 | $16.085,22 | $32.172,93 | 0.4999614075370567 |

|
||
| 9827 |

Oren
OREN
|
$0,00001736 | 2.0% | 21.9% | 52.9% | 0.0% | $6.208,23 | $15.965,47 | $15.965,47 | 1.0 |
|
||
| 9931 |

ComputeBase
COMPUTE
|
$0.061523 | 0.0% | 0.3% | 0.2% | 10.5% | $6,30 | $15.230,32 | $15.230,32 | 1.0 |

|
||
| 9988 |

TetraScore
SCORE
|
$0,00001483 | 0.3% | 0.7% | 11.8% | 36.0% | $51,40 | $14.824,64 | $14.824,64 | 1.0 |
|
||
| 10036 |

Omnis Genesis by Virtuals
OMNI
|
$0,00001730 | 0.0% | 0.5% | 4.0% | 7.1% | $1,51 | $14.614,96 | $14.614,96 | 1.0 |

|
||
| 10241 |

Checkr
$CHECKR
|
$0.064792 | 0.0% | 3.4% | 15.6% | 29.4% | $110,58 | $13.409,95 | $46.245,56 | 0.28997277356191165 |

|
||
| 10278 |

SYLVI AGENT
SYLVIAI
|
$0,00001318 | 0.0% | 6.4% | 10.5% | 27.4% | $1,29 | $13.179,76 | $13.179,76 | 1.0 |

|
||
| 10402 |

HooderScan
HOODER
|
$0,00001675 | 0.0% | 49.2% | 92.6% | 70.6% | $1.062,53 | $12.560,66 | $16.747,55 | 0.75 |

|
||
| 10422 |

PATRIOT
PATRIOT
|
$0,00001248 | 0.0% | 3.9% | 11.6% | 27.8% | $5,00 | $12.477,16 | $12.477,16 | 1.0 |

|
||
| 10449 |

BelieveScreener
BSCREENER
|
$0,00001237 | 0.0% | 1.0% | 14.7% | 15.1% | $1,00000 | $12.367,35 | $12.367,35 | 1.0 |

|
||
| 10513 |

Deepnets
DNET
|
$0,00001265 | 0.0% | 3.1% | 12.2% | 48.3% | $21,19 | $12.115,62 | $12.115,62 | 1.0 |

|
||
| 10624 |

Generative Market eXplorer
AIGMX
|
$0,00001164 | 0.1% | 4.1% | 13.5% | 29.4% | $18,60 | $11.640,60 | $11.640,60 | 1.0 |

|
||
| 10712 |

Wallitelli
WALLI
|
$0,00001129 | 0.0% | 25.2% | 47.4% | 97.5% | $580.383 | $11.291,22 | $11.291,22 | 1.0 |

|
||
| 10716 |

Anti Rug Agent
ANTIRUG
|
$0,00001129 | 0.0% | 3.6% | 16.5% | 29.6% | $12,65 | $11.282,44 | $11.282,44 | 1.0 |

|
||
| 10813 |

SocialCrab
SCRB
|
$0,00001089 | 0.0% | 6.7% | 4.9% | 23.5% | $211,62 | $10.888,71 | $10.888,71 | 1.0 |

|
||
| 10852 |

FOCO
FOCO
|
$0,00001070 | 0.3% | 94.8% | 99.1% | 0.0% | $8.709,56 | $10.701,06 | $10.701,06 | 1.0 |
|
||
| 10889 |

Strategic ETH Reserve
SΞR
|
$0,0001053 | 0.0% | 4.5% | 4.5% | 14.7% | $3,90 | $10.531,20 | $10.531,20 | 1.0 |

|
||
| 10960 |

BubbleFlap
BFLAP
|
$0,00001143 | 0.5% | 0.1% | 7.7% | 19.2% | $42,29 | $10.319,29 | $10.319,29 | 1.0 |

|
||
| 11301 |

Dyordotcom
DYOR
|
$0,00001877 | 0.0% | 4.8% | 4.8% | 77.8% | $15,10 | $9.138,38 | $9.138,38 | 0.9999999999999998 |

|
||
| 11325 |

Liquidum
LIDUM
|
$0.059045 | 0.0% | 29.2% | 29.2% | 32.9% | $2,78 | $9.044,88 | $9.044,88 | 1.0 |

|
||
| 11376 |

Trio ICM
TRIO
|
$0.058830 | 0.0% | 11.6% | 11.6% | 26.1% | $19,11 | $8.830,23 | $8.830,23 | 1.0 |

|
||
| 11561 |

Hoodwatch
WATCH
|
$0.058263 | 0.0% | 2.8% | 15.3% | 62.3% | $83,15 | $8.262,74 | $8.262,74 | 1.0 |

|
||
| 11606 |

Arcvein
ARCVEIN
|
$0.058128 | 0.0% | 15.0% | 74.1% | 0.0% | $352,07 | $8.127,69 | $8.127,69 | 1.0 |
|
||
| 11630 |

Exodus AI
EXO
|
$0.058169 | 0.0% | 4.1% | 11.9% | 25.9% | $4,09 | $8.073,65 | $8.073,65 | 1.0 |

|
||
| 11823 |

AAAI_agent by Virtuals
AAAI
|
$0.057507 | 0.0% | 23.7% | 23.7% | 26.6% | $45,05 | $7.506,61 | $7.506,61 | 1.0 |

|
||
| 11995 |

BelievePad
BPAD
|
$0.057082 | 0.0% | 16.0% | 16.0% | 21.7% | $1,90 | $7.062,76 | $7.062,76 | 1.0 |

|
||
| 12097 |

PredicTools
PREDIC
|
$0.056815 | 0.0% | 3.9% | 18.8% | 30.1% | $38,23 | $6.811,74 | $6.811,74 | 1.0 |

|
||
| 12163 |

REPO ANALYZER AI
REPOALYZE
|
$0.056713 | 0.0% | 7.3% | 7.3% | 14.6% | $24,95 | $6.644,71 | $6.710,78 | 0.9901548163052811 |

|
||
| 12190 |

Inferium
IFR
|
$0,00007615 | 0.0% | 4.8% | 11.5% | 7.1% | $4,23 | $6.576,19 | $19.036,88 | 0.3454448337994268 |

|
||
| 12205 |

QuantifyAI
QGG
|
$0.056552 | 0.0% | 3.9% | 0.8% | 19.3% | $1,63 | $6.541,31 | $6.541,31 | 1.0 |

|
||
| 12255 |

Fable
FABLE
|
$0.056972 | 0.0% | 5.9% | 26.3% | 10.0% | $8,67 | $6.425,59 | $6.425,59 | 1.0 |
|
||
| 12282 |

BOW
BOW
|
$0.057337 | 0.0% | 1.1% | 13.6% | 22.8% | $3,36 | $6.372,84 | $6.372,84 | 1.0 |

|
||
| 12305 |

Chain-Fox
CFX
|
Satın Al
|
$0.056336 | 0.0% | 0.7% | 8.2% | 13.3% | $2,08 | $6.334,84 | $6.334,84 | 1.0 |

|
|
| 12340 |

Kolytics
KOLT
|
$0,0007840 | 0.0% | 39.8% | 73.3% | 76.6% | $3.101,84 | $6.271,89 | $7.839,87 | 0.8 |

|
||
| 12498 |

VirtuBeauty by Virtuals
VBEA
|
$0.055943 | 0.1% | 4.0% | 17.3% | 30.9% | $4,76 | $5.942,86 | $5.942,86 | 1.0 |

|
||
| 12629 |

We Will Huddle
HUDDLE
|
$0.055726 | 0.2% | 5.0% | 13.2% | 25.9% | $1,64 | $5.674,57 | $5.674,57 | 1.0 |

|
||
| 12656 |

Ocula
OCULA
|
$0.055908 | 0.2% | 1.9% | 3.4% | 91.2% | $107,02 | $5.628,49 | $5.628,49 | 1.0 |
|
||
| 12726 |

Kyro Markets
KYRO
|
$0.055463 | 0.3% | 2.0% | 32.7% | 0.0% | $49,80 | $5.463,03 | $5.463,03 | 1.0 |
|
||
| 13054 |

Opus The Trencher
OPUS
|
$0.054985 | 0.2% | 9.1% | 21.1% | 32.3% | $3,39 | $4.842,49 | $4.842,49 | 1.0 |

|
||
| 13130 |

toaster.trade
TOASTER
|
$0.055539 | 0.0% | 21.0% | 21.0% | 21.0% | $1,36 | $4.707,97 | $4.707,97 | 1.0 |

|
||
| 13376 |

ALINA AI
ALINAINTEL
|
$0.054322 | 0.0% | 3.7% | 3.7% | 26.4% | $1,32 | $4.309,92 | $4.309,92 | 1.0 |

|
||
| 13424 |

RobinSight
SIGHT
|
$0.054230 | 0.0% | 10.0% | 10.9% | 34.3% | $7,98 | $4.229,74 | $4.229,74 | 1.0 |
|
||
| 13427 |

Degen Social Media
DEGEN
|
$0.054233 | 0.0% | 1.1% | 1.1% | 15.5% | $183,37 | $4.227,19 | $4.227,19 | 1.0 |

|
||
| 13454 |

RiceLabs
RICE
|
$0.054191 | 0.0% | 3.3% | 3.3% | 13.4% | $1,11 | $4.191,17 | $4.191,17 | 1.0 |

|
||
| 13490 |

Sounder Liquidity
SOUNDER
|
$0.054157 | 0.0% | 2.0% | 30.8% | 77.7% | $4,91 | $4.156,83 | $4.156,83 | 1.0 |
|
||
| 13567 |

INVARA Core
INVR
|
$0.054482 | 0.7% | 5.9% | 41.7% | 0.0% | $166,62 | $4.040,14 | $4.481,53 | 0.9015099837412969 |
|
||
| 13609 |

FutureScanX
FSX
|
$0.054001 | 0.0% | 0.8% | 0.5% | 6.5% | $7,00 | $3.980,77 | $4.000,78 | 0.9949993937545369 |

|
||
| 13717 |

SimiliScan
SMS
|
$0,00003844 | 0.0% | 3.0% | 5.3% | 22.5% | $8,64 | $3.844,49 | $3.844,49 | 1.0 |

|
||
| 13760 |

XScouter AI
XSAI
|
$0,007581 | 0.0% | 0.0% | 2.4% | 13.1% | $3,48 | $3.790,31 | $3.790,31 | 1.0 |

|
||
| 13807 |

Julia Swarm Syndicate
JSS
|
$0.053858 | 0.0% | 3.2% | 18.6% | 25.8% | $1,85 | $3.720,44 | $3.720,44 | 1.0 |

|
||
| 13851 |

Super Intelligent Identity
SIMD
|
$0.053647 | 0.0% | 5.0% | 17.0% | 95.4% | $72,82 | $3.647,34 | $3.647,34 | 1.0 |
|
||
| 13928 |

HUME MARKETS
HUME
|
$0.053554 | 0.0% | 2.1% | 28.7% | 89.8% | $1,18 | $3.554,18 | $3.554,18 | 1.0 |
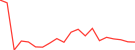
|
||
| 13966 |

Thesis AI
THESIS
|
$0.053512 | 1.1% | 1.3% | 85.5% | 97.1% | $8,35 | $3.511,07 | $3.511,07 | 1.0 |
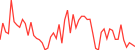
|
||
| 14027 |

0xsim by Virtuals
SAGE
|
$0.053446 | 0.1% | 3.7% | 11.7% | 25.7% | $1,03 | $3.445,60 | $3.445,60 | 1.0 |

|
||
| 14029 |

DexChart
CHART
|
$0.053445 | 0.0% | 4.0% | 1.3% | 18.1% | $2,63 | $3.444,95 | $3.444,95 | 1.0 |
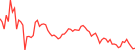
|
||
| 14314 |

AstheraFi
ASTHER
|
$0.053107 | 0.0% | 7.8% | 7.8% | 12.4% | $8,06 | $3.107,11 | $3.107,11 | 1.0 |

|
||
| 14378 |

Grail
GRAIL
|
$0.053352 | 0.0% | 7.4% | 1.4% | 62.6% | $3,88 | $3.021,79 | $3.021,79 | 1.0 |
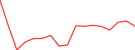
|
||
| 14516 |

VoidScreener
VOID
|
$0.052895 | 0.0% | 13.7% | 13.7% | 15.5% | $6,90 | $2.876,09 | $2.876,09 | 1.0 |

|
||
| 14642 |

Quanta
QNTA
|
$0.052794 | 0.0% | 4.1% | 9.6% | 23.1% | $1,49 | $2.737,97 | $2.737,97 | 1.0 |
|
||
| 14646 |

Lashi
LASHI
|
$0.052735 | 0.0% | 6.3% | 6.3% | 27.5% | $1,50 | $2.734,94 | $2.734,94 | 1.0 |

|
||
| 14818 |

BubbleLabs
BUBBLE
|
$0.052632 | 0.0% | 5.9% | 5.9% | 5.9% | $3,64 | $2.552,76 | $2.552,76 | 1.0 |

|
||
| 14886 |

SWARM ENGINE
SWARM
|
$0.052504 | 0.0% | 3.1% | 16.3% | 93.5% | $2,90 | $2.486,59 | $2.486,59 | 1.0 |
|
||
| 14992 |

Glint
$GLINT
|
$0.073346 | 0.0% | 30.1% | 46.3% | 0.0% | $401,86 | $2.342,52 | $3.346,46 | 0.7000000000000001 |

|
||
| 14997 |

MCAPS
MCAPS
|
$0.052337 | 0.0% | 7.4% | 18.4% | 99.1% | $36,69 | $2.336,75 | $2.336,75 | 1.0 |
|
||
| 15037 |

Raindrop
RAIN
|
Satın Al
|
$0.052272 | 0.0% | 2.5% | 11.7% | 24.6% | $2,26 | $2.271,28 | $2.271,28 | 1.0 |

|
|
| 15128 |

Lens
LENS
|
$0.052195 | 0.0% | 7.6% | 8.2% | 73.3% | $39,12 | $2.154,83 | $2.194,48 | 0.981932825344961 |

|
||
| 15166 |

sinex
SINX
|
$0.061206 | 0.0% | 3.4% | 3.4% | 31.2% | $1,03 | $2.082,37 | $2.082,37 | 1.0 |

|
||
| 15244 |

Pantheon
PNTH
|
$0.051962 | 0.0% | 4.0% | 22.1% | 28.4% | $10,96 | $1.961,79 | $1.961,79 | 1.0 |

|
||
| 15326 |

Alpha Lens X
ALPHAX
|
$0.051829 | 0.0% | 21.0% | 21.0% | 21.0% | $4,58 | $1.759,76 | $1.759,76 | 1.0 |

|
||
| 15510 |

Attention Trade
ATTN
|
$0.067799 | 0.0% | 23.1% | 23.1% | 44.7% | $1,52 | $951,55 | $951,55 | 1.0 |

|
||
| 15583 |

Shitcoinscreener
SCREENER
|
$0.051719 | 0.0% | 58.0% | 58.0% | 58.0% | $152,81 | $648,77 | $1.719,38 | 0.3773250482452647 |

|
||
| 15738 |

Diverge Loop
DLC
|
$0.063018 | 0.0% | 99.5% | 99.5% | 99.7% | $1,81 | $268,56 | $301,76 | 0.89 |

|
||

KROWN
KRW
|
$0.051901 | 0.6% | 0.8% | 5.5% | 44.7% | $1.697,65 | - | $19.014,97 |

|
||||

Bitcoin Silver AI
BSAI
|
$1.633,96 | 0.0% | 0.6% | 0.8% | 15.0% | $79.763,38 | - | $1.633.945.459.364 |

|
||||

Inery
$INR
|
$0,0004408 | 0.0% | 1.2% | 1.2% | 2.3% | $1,98 | - | $352.651 |

|
||||

DataPort Navigator by Virtuals
PORT
|
$0,00002216 | 0.0% | 6.4% | 11.1% | 30.8% | $3,48 | - | $22.164,14 |

|
||||

AXiS ALiVE
AXIS
|
$284,43 | 2.6% | 4.6% | 3.9% | 29.0% | $468,02 | - | $288.278.809 |

|
||||

Centcex
CENX
|
$0,00005765 | 0.2% | 2.0% | 10.8% | 15.7% | $9,16 | - | $576.479 |

|
||||

Sypool
SYP
|
$0,00006692 | 0.3% | 3.0% | 13.2% | 15.2% | $56,44 | - | $66.920,24 |

|
||||

CyberHarbor
CHT
|
$0,00005579 | 0.0% | 0.4% | 0.0% | 50.7% | $70,98 | - | $55.791,03 |

|
||||

Reflecto
RTO
|
$0.096892 | 0.0% | 1.4% | 5.4% | 16.3% | $47,49 | - | $689.150 |

|
||||

Ness Lab
NESS
|
$0,001521 | 0.3% | 1.3% | 17.8% | 37.5% | $11.522,39 | - | - |

|
||||

XTTA
XTTA
|
$0,006086 | 0.3% | 5.8% | 22.2% | 52.7% | $3.432,58 | - | $1.967.619 |

|
||||

AltsDaddy
DDY
|
$0,00 | - | - | - | - | - | - | - |

|
||||

Pullix
PLX
|
$0,0006227 | 0.0% | 3.3% | 15.4% | 19.2% | $2,11 | - | $124.539 |

|
||||

Trading Views
TRADINGVIEWS
|
$0,00 | - | - | - | - | - | - | - |

|
||||
207 sonuçtan 101 ile 200 arası gösteriliyor
Satırlar
Önde Gelen Analiz Coin'leri Piyasa Değeri Grafiği
Aşağıdaki grafik, Pyth Network, The Graph, SoSoValue ve diğerleri dahil olmak üzere belirli bir süre içinde önde gelen Analiz kategorisindeki piyasa değerini ve hakimiyetini göstermektedir.
Önde Gelen Analiz Coin'leri Performans Grafiği
Aşağıdaki grafik, farklı dönemlerde fiyat cinsinden kazanç ve kayıp yüzdelerini takip ederek önde gelen Analiz coin'lerinin zaman içindeki göreceli performansını göstermektedir.


 Ya da uygulama mağazalarından göz atın