
Portfolios
Add to New Portfolio

Frax (prev. FXS)
FRAX / ETH
#731
ETH0.0001345
4.8%
0.053964 BTC
4.9%
0.0001345 ETH
4.8%
$0.2393
24h Range
$0.2700


Get FRAX Alerts within the CoinGecko app
Following Frax's North Star Hardfork, Frax Share (FXS) has been renamed to Frax (FRAX). For detailed information, kindly visit their announcement here.
Convert Frax (prev. FXS) to Ether (FRAX to ETH)
The price of converting 1 Frax (prev. FXS) (FRAX) to ETH is ETH0.00013452 today.
FRAX
ETH
1 FRAX = ETH0.00013452
FRAX to ETH Chart
Frax (prev. FXS) (FRAX) is worth ETH0.00013452 today, which is a 0.4% decline from an hour ago and a 5.7% increase since yesterday. The value of FRAX today is 5.3% lower compared to its value 7 days ago. In the last 24 hours, the total volume of Frax (prev. FXS) traded was ETH471.469.
Use log scale
View in full screen
Download as PNG
Download as SVG
Download as JPEG
Download as PDF
Comparison is only available on line charts.
Switch & Compare
Switch & Compare
Need more data?
Explore our API
| 1h | 24h | 7d | 14d | 30d | 1y |
|---|---|---|---|---|---|
| 0.4% | 5.7% | 5.3% | 1.6% | 12.4% | 91.5% |
Frax (prev. FXS) Statistics
|
Market Cap
Market Cap = Current Price x Circulating Supply
Refers to the total market value of a cryptocurrency’s circulating supply. It is similar to the stock market’s measurement of multiplying price per share by shares readily available in the market (not held & locked by insiders, governments) Read More |
ETH12,593.6920 |
|---|---|
|
Market Cap / FDV
The proportion of current market capitalization compares to market capitalization when meeting max supply.
The closer the Mkt Cap/FDV to 1, the closer the current market capitalization to its fully diluted valuation and vice versa. Learn more about Mkt Cap/FDV here. |
0.94 |
|
Market Cap / TVL Ratio
Ratio of market capitalization over total value locked of this asset. A ratio of more than 1.0 refers to its market cap being greater than its total value locked.
MC/TVL is used to approximate a protocol’s market value vs. the amount in assets it has staked/locked. |
0.08 |
|
Fully Diluted Valuation
Fully Diluted Valuation (FDV) = Current Price x Total Supply
Fully Diluted Valuation (FDV) is the theoretical market capitalization of a coin if the entirety of its supply is in circulation, based on its current market price. The FDV value is theoretical as increasing the circulating supply of a coin may impact its market price. Also depending on the tokenomics, emission schedule or lock-up period of a coin's supply, it may take a significant time before its entire supply is released into circulation. Learn more about FDV here. |
ETH13,408.8581 |
|
Fully Diluted Valuation / TVL Ratio
Ratio of fully diluted valuation (FDV) over total value locked (TVL) of this asset. A ratio of more than 1.0 means that the FDV is greater than its TVL.
FDV/TVL is used to approximate a protocol’s fully diluted market value vs. the amount in assets it has staked/locked. |
0.09 |
|
24 Hour Trading Vol
A measure of a cryptocurrency trading volume across all tracked platforms in the last 24 hours. This is tracked on a rolling 24-hour basis with no open/closing times.
Read More |
ETH471.4688 |
|
Total Value Locked (TVL)
Capital deposited into the platform in the form of loan collateral or liquidity trading pool.
Data provided by Defi Llama |
- |
|
Circulating Supply
The amount of coins that are circulating in the market and are tradeable by the public. It is comparable to looking at shares readily available in the market (not held & locked by insiders, governments).
Read More |
93.622M
|
|
Total Supply
The amount of coins that have already been created, minus any coins that have been burned (removed from circulation). It is comparable to issued shares in the stock market.
Total Supply = Onchain supply - burned tokens |
99.681M |
|
Max Supply
The maximum number of coins coded to exist in the lifetime of the cryptocurrency. It is comparable to the maximum number of issuable shares in the stock market.
Max Supply = Theoretical maximum as coded |
∞ |
Buy / Sell
 Sponsored
Wallet
Sponsored
Earn Crypto
Sponsored
FAQs
-
How much is 1 Frax (prev. FXS) worth in ETH?
- As of now, the price of 1 Frax (prev. FXS) (FRAX) in Ether (ETH) is about ETH0.0001339.
-
How many FRAX can I buy for ETH1?
- You can buy approximately 7469 FRAX for ETH1 today.
-
How do I convert the price of FRAX to ETH?
- Calculate Frax (prev. FXS)'s price in Ether by inputting your desired amount on CoinGecko’s FRAX to ETH converter. Track its historical price movements on the FRAX to ETH chart, and explore more crypto prices in ETH.
-
What is the highest price of FRAX/ETH in history?
- The all-time high price of 1 FRAX in ETH is ETH0.04136. It remains to be seen if the value of 1 FRAX/ETH will exceed the current all-time high.
-
What is the price trend of Frax (prev. FXS) in ETH?
- Over the last month, the price of Frax (prev. FXS) (FRAX) has gone down by -9.10% against the Ether (ETH). In fact, Frax (prev. FXS) has underperformed against the broader crypto market, which is up by 8.20%.
FRAX / ETH Conversion Tables
The conversion rate of Frax (prev. FXS) (FRAX) to ETH is ETH0.00013452 for every 1 FRAX. This means you can exchange 5 FRAX for ETH0.00067259 or ETH50.000 for 371700 FRAX, excluding fees. Refer to our conversion tables for popular FRAX trading amounts in their corresponding ETH prices and vice versa.
Convert Frax (prev. FXS) (FRAX) to ETH
| FRAX | ETH |
|---|---|
| 0.01 FRAX | 0.00000135 ETH |
| 0.1 FRAX | 0.00001345 ETH |
| 1 FRAX | 0.00013452 ETH |
| 2 FRAX | 0.00026903 ETH |
| 5 FRAX | 0.00067259 ETH |
| 10 FRAX | 0.00134517 ETH |
| 20 FRAX | 0.00269034 ETH |
| 50 FRAX | 0.00672585 ETH |
| 100 FRAX | 0.01345170 ETH |
| 1000 FRAX | 0.13451702 ETH |
Convert Ether (ETH) to FRAX
| ETH | FRAX |
|---|---|
| 0.01 ETH | 74.340 FRAX |
| 0.1 ETH | 743.400 FRAX |
| 1 ETH | 7434 FRAX |
| 2 ETH | 14868 FRAX |
| 5 ETH | 37170 FRAX |
| 10 ETH | 74340 FRAX |
| 20 ETH | 148680 FRAX |
| 50 ETH | 371700 FRAX |
| 100 ETH | 743400 FRAX |
| 1000 ETH | 7434003 FRAX |
7-day price history of Frax (prev. FXS) (FRAX) to ETH
The daily exchange rate of Frax (prev. FXS) (FRAX) to ETH fluctuated between a high of ETH0.00014691 on Friday and a low of ETH0.00012676 on Wednesday in the last 7 days. Within the week, the price of FRAX in ETH had the largest 24-hour price movement on Thursday (0 days ago) by ETH0.00000725 (5.7%).
Compare the daily prices of Frax (prev. FXS) (FRAX) in ETH and their 24-hour price movements for the week.
Compare the daily prices of Frax (prev. FXS) (FRAX) in ETH and their 24-hour price movements for the week.
| Date | Day of the week | 1 FRAX to ETH | 24hr Changes | Change % |
|---|---|---|---|---|
| July 30, 2026 | Thursday | ETH0.00013452 | ETH0.00000725 | 5.7% |
| July 29, 2026 | Wednesday | ETH0.00012676 | -ETH0.00000617 | 4.6% |
| July 28, 2026 | Tuesday | ETH0.00013293 | -ETH0.00000346 | 2.5% |
| July 27, 2026 | Monday | ETH0.00013640 | -ETH0.00000450 | 3.2% |
| July 26, 2026 | Sunday | ETH0.00014090 | -ETH0.00000523 | 3.6% |
| July 25, 2026 | Saturday | ETH0.00014613 | -ETH0.000000787553 | 0.5% |
| July 24, 2026 | Friday | ETH0.00014691 | ETH0.00000596 | 4.2% |
Articles Related to Frax (prev. FXS)

Podcast
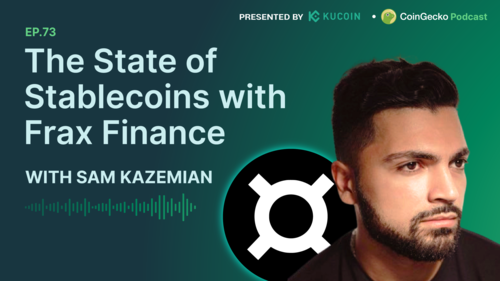
The State of Stablecoins with Frax Finance w/ Sam Kazemian - Ep.73 Podcast Notes
Wendy M.
4.5 (4 votes)


 Or check it out in the app stores

