



Portfolios
Add to New Portfolio


MBG By Multibank Group
MBG / SGD
#653
S$0.1320
0.1%
0.051231 BTC
0.5%
0.00003847 ETH
0.0%
$0.1024
24h Range
$0.1044


Get MBG Alerts within the CoinGecko app

Convert MBG By Multibank Group to Singapore Dollar (MBG to SGD)
The price of converting 1 MBG By Multibank Group (MBG) to SGD is S$0.131996 today.
MBG
SGD
1 MBG = S$0.131996
How to Buy MBG with SGD
Show-
1. Identify where to trade MBG
-
2. Choose a suitable exchange
-
A convenient option to buy MBG with SGD is through a centralized exchange (CEX) that supports SGD deposits. When choosing an exchange, compare its fee structure, security, and available assets. Most CEXes have maker/taker fees and may include additional withdrawal & deposit fees. Remember to allocate some funds for fees when buying MBG.
-
3. Register an account
-
Create an account with your preferred crypto exchange and complete the KYC process. Once your account is verified, choose your preferred payment method and deposit SGD into your account. Most exchanges offer options for bank transfers and credit/debit card payments.
-
4. You’re now ready to buy MBG with SGD!
-
Select MBG By Multibank Group (MBG) and enter the amount of SGD you’d like to trade. Verify the details before confirming your transaction. Once you've received MBG, you may want to store it on a crypto wallet to retain custody of your assets.
MBG to SGD Chart
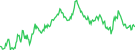
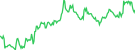
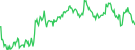
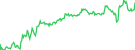
MBG By Multibank Group (MBG) is worth S$0.131996 today, which is a 0.1% increase from an hour ago and a 0.2% increase since yesterday. The value of MBG today is 0.2% lower compared to its value 7 days ago. In the last 24 hours, the total volume of MBG By Multibank Group traded was S$8,377,585.
Use log scale
View in full screen
Download as PNG
Download as SVG
Download as JPEG
Download as PDF
View in full screen
Comparison is only available on line charts.
Switch & Compare
Switch & Compare
Need more data?
Explore our API
| 1h | 24h | 7d | 14d | 30d | 1y |
|---|---|---|---|---|---|
| 0.1% | 0.2% | 0.2% | 0.3% | 0.6% | 90.7% |
MBG By Multibank Group Statistics
| Market Cap | S$43.456M |
|---|---|
| Market Cap / FDV | 0.34 |
| Outstanding Token Value | S$108.781M |
| Fully Diluted Valuation | S$129.033M |
| 24 Hour Trading Vol | S$8.378M |
| Circulating Supply | 329.211M |
| Outstanding Supply | 824.12M |
| Total Supply | 977.515M |
| Max Supply | 1B |
Buy / Sell
 Sponsored
Wallet
Sponsored
Earn Crypto
Sponsored
FAQs
-
How much is 1 MBG By Multibank Group worth in SGD?
- As of now, the price of 1 MBG By Multibank Group (MBG) in Singapore Dollar (SGD) is about S$0.1320.
-
How many MBG can I buy for S$1?
- You can buy approximately 7.58 MBG for S$1 today.
-
How do I convert the price of MBG to SGD?
- Calculate MBG By Multibank Group's price in Singapore Dollar by inputting your desired amount on CoinGecko’s MBG to SGD converter. Track its historical price movements on the MBG to SGD chart, and explore more crypto prices in SGD.
-
What is the highest price of MBG/SGD in history?
- The all-time high price of 1 MBG in SGD is S$3.27. It remains to be seen if the value of 1 MBG/SGD will exceed the current all-time high.
-
What is the price trend of MBG By Multibank Group in SGD?
- Over the last month, the price of MBG By Multibank Group (MBG) has gone down by -0.60% against the Singapore Dollar (SGD). In fact, MBG By Multibank Group has underperformed against the broader crypto market, which is up by 8.00%.
MBG / SGD Conversion Tables
The conversion rate of MBG By Multibank Group (MBG) to SGD is S$0.131996 for every 1 MBG. This means you can exchange 5 MBG for S$0.659980 or S$50.00 for 378.80 MBG, excluding fees. Refer to our conversion tables for popular MBG trading amounts in their corresponding SGD prices and vice versa.
Convert MBG By Multibank Group (MBG) to SGD
| MBG | SGD |
|---|---|
| 0.01 MBG | 0.00131996 SGD |
| 0.1 MBG | 0.01319960 SGD |
| 1 MBG | 0.131996 SGD |
| 2 MBG | 0.263992 SGD |
| 5 MBG | 0.659980 SGD |
| 10 MBG | 1.32 SGD |
| 20 MBG | 2.64 SGD |
| 50 MBG | 6.60 SGD |
| 100 MBG | 13.20 SGD |
| 1000 MBG | 132.00 SGD |
Convert Singapore Dollar (SGD) to MBG
| SGD | MBG |
|---|---|
| 0.01 SGD | 0.075760 MBG |
| 0.1 SGD | 0.757599 MBG |
| 1 SGD | 7.58 MBG |
| 2 SGD | 15.15 MBG |
| 5 SGD | 37.88 MBG |
| 10 SGD | 75.76 MBG |
| 20 SGD | 151.52 MBG |
| 50 SGD | 378.80 MBG |
| 100 SGD | 757.60 MBG |
| 1000 SGD | 7575.99 MBG |
7-day price history of MBG By Multibank Group (MBG) to SGD
The daily exchange rate of MBG By Multibank Group (MBG) to SGD fluctuated between a high of S$0.132134 on Wednesday and a low of S$0.131477 on Sunday in the last 7 days. Within the week, the price of MBG in SGD had the largest 24-hour price movement on Sunday (6 days ago) by -S$0.00039557 (0.3%).
Compare the daily prices of MBG By Multibank Group (MBG) in SGD and their 24-hour price movements for the week.
Compare the daily prices of MBG By Multibank Group (MBG) in SGD and their 24-hour price movements for the week.
| Date | Day of the week | 1 MBG to SGD | 24hr Changes | Change % |
|---|---|---|---|---|
| September 26, 2026 | Saturday | S$0.131996 | S$0.00028660 | 0.2% |
| September 25, 2026 | Friday | S$0.132118 | S$0.00022636 | 0.2% |
| September 24, 2026 | Thursday | S$0.131891 | -S$0.00024307 | 0.2% |
| September 23, 2026 | Wednesday | S$0.132134 | S$0.00036960 | 0.3% |
| September 22, 2026 | Tuesday | S$0.131765 | S$0.00002105 | 0.0% |
| September 21, 2026 | Monday | S$0.131744 | S$0.00026721 | 0.2% |
| September 20, 2026 | Sunday | S$0.131477 | -S$0.00039557 | 0.3% |



























 Or check it out in the app stores



