



Porteføljer
Føj til ny portefølje


Førende Analyser-coins efter markedsværdi
Markedsværdien for Analyser i dag er 1,27 Milliard $, en ændring på -2.4% de seneste 24 timer.
Højdepunkter
$1.264.644.553
Markedsværdi
3.2%

$126.061.495
24t handelsvolumen


| # | Coin | Pris | 1t | 24t | 7d | 30d | 24t volumen | Markedsværdi | FDV | Markedsværdi/FDV | De seneste 7 dage | ||
|---|---|---|---|---|---|---|---|---|---|---|---|---|---|
| 8745 |

opensvm.com
SVMAI
|
$0,00002386 | 0.0% | 0.5% | 12.2% | 20.8% | $37,01 | $23.846,59 | $23.846,59 | 1.0 |

|
||
| 8752 |

AInalyst
AIN
|
$0,00002379 | 0.0% | 9.8% | 21.6% | 35.9% | $55,35 | $23.790,93 | $23.790,93 | 1.0 |

|
||
| 8880 |

Tradescoop by Virtuals
SCOOP
|
$0,00002268 | 0.0% | 25.5% | 25.5% | 27.0% | $31,60 | $22.682,43 | $22.682,43 | 1.0 |

|
||
| 9040 |

Helio
HELIO
|
$0,00002295 | 0.0% | 2.3% | 9.0% | 21.8% | $1,26 | $21.165,57 | $21.165,57 | 1.0 |

|
||
| 9047 |

Navigate
NVG8
|
$0,00008374 | 0.0% | 0.8% | 0.8% | 9.4% | $2,05 | $21.128,81 | $83.741,27 | 0.25231056655503403 |

|
||
| 9145 |

ReVault
RVAULT
|
$0.062061 | 0.1% | 5.1% | 23.4% | 27.3% | $6,95 | $20.605,32 | $20.605,32 | 1.0 |

|
||
| 9169 |

OddsEngine
ODDS
|
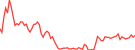
$0,00002055 | 0.5% | 40.4% | 54.4% | 0.0% | $1.598,66 | $20.334,84 | $20.334,84 | 1.0 |
|
||
| 9171 |

Pentagon Pizza Watch
PPW
|
$0,00002023 | 0.0% | 18.6% | 32.0% | 38.9% | $221,62 | $20.231,84 | $20.231,84 | 1.0 |

|
||
| 9232 |

Velvet AI
VELAI
|
$0,00001782 | 4.5% | 9.1% | 13.6% | 26.5% | $248,67 | $19.692,93 | $19.692,93 | 1.0 |

|
||
| 9252 |

Hyperbot
BOT
|
$0,0001552 | 0.0% | 4.0% | 39.3% | 36.9% | $63,57 | $19.533,36 | $155.232 | 0.125833333 |

|
||
| 9301 |

Howl.fi
HOWL
|
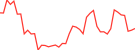
$0,00001925 | 0.1% | 25.0% | 53.2% | 0.0% | $1.346,56 | $19.248,69 | $19.248,69 | 1.0 |
|
||
| 9444 |

Melvin
MEL
|
$0,00001808 | 0.0% | 4.8% | 30.0% | 21.0% | $2,13 | $18.081,20 | $18.081,20 | 1.0 |

|
||
| 9599 |

Mind AI
MA
|
$0,00003748 | 0.0% | 2.1% | 2.8% | 44.1% | $150,27 | $16.985,56 | $18.741,31 | 0.9063165495639126 |

|
||
| 9727 |

gemxbt
GEMXBT
|
$0,00001697 | 0.0% | 12.1% | 25.6% | 37.8% | $288,53 | $16.119,40 | $16.119,40 | 1.0 |

|
||
| 9730 |

Prometheus
PROMETHEUS
|
$0,00003217 | 0.0% | 25.3% | 25.3% | 5.7% | $5,78 | $16.085,22 | $32.172,93 | 0.4999614075370567 |

|
||
| 9849 |

Oren
OREN
|
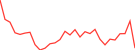
$0,00001658 | 4.1% | 5.1% | 57.6% | 0.0% | $2.705,24 | $15.242,26 | $15.242,26 | 1.0 |
|
||
| 9845 |

ComputeBase
COMPUTE
|
$0.061523 | 0.0% | 0.3% | 0.2% | 10.5% | $6,30 | $15.230,32 | $15.230,32 | 1.0 |

|
||
| 9868 |

UpScalp
UPSCALP
|
$0,00001685 | 0.8% | 4.3% | 14.4% | 38.8% | $55,57 | $15.108,47 | $16.843,61 | 0.8969851681456672 |

|
||
| 9945 |

Omnis Genesis by Virtuals
OMNI
|
$0,00001730 | 0.0% | 0.5% | 4.0% | 7.1% | $1,51 | $14.614,96 | $14.614,96 | 1.0 |

|
||
| 9967 |

TetraScore
SCORE
|
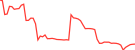
$0,00001444 | 0.0% | 2.7% | 14.0% | 40.1% | $57,06 | $14.439,20 | $14.439,20 | 1.0 |
|
||
| 10188 |

SYLVI AGENT
SYLVIAI
|
$0,00001318 | 0.0% | 6.4% | 10.5% | 27.4% | $1,29 | $13.179,76 | $13.179,76 | 1.0 |

|
||
| 10314 |

HooderScan
HOODER
|
$0,00001675 | 0.0% | 49.2% | 92.6% | 70.6% | $1.062,53 | $12.560,66 | $16.747,55 | 0.75 |

|
||
| 10316 |

Checkr
$CHECKR
|
$0.064484 | 0.0% | 5.5% | 20.7% | 36.4% | $0,9245 | $12.546,65 | $43.268,26 | 0.2899734201884617 |

|
||
| 10332 |

PATRIOT
PATRIOT
|
$0,00001248 | 0.0% | 3.9% | 11.6% | 27.8% | $5,00 | $12.477,16 | $12.477,16 | 1.0 |

|
||
| 10365 |

BelieveScreener
BSCREENER
|
$0,00001237 | 0.0% | 1.0% | 14.7% | 15.1% | $1,00000 | $12.367,35 | $12.367,35 | 1.0 |

|
||
| 10610 |

Wallitelli
WALLI
|
$0,00001129 | 0.0% | 25.2% | 47.4% | 97.5% | $580.383 | $11.291,22 | $11.291,22 | 1.0 |

|
||
| 10614 |

Anti Rug Agent
ANTIRUG
|
$0,00001129 | 0.0% | 3.6% | 16.5% | 29.6% | $12,65 | $11.282,44 | $11.282,44 | 1.0 |

|
||
| 10726 |

SocialCrab
SCRB
|
$0,00001089 | 0.0% | 6.7% | 4.9% | 23.5% | $211,62 | $10.888,71 | $10.888,71 | 1.0 |

|
||
| 10755 |

Generative Market eXplorer
AIGMX
|
$0,00001076 | 0.0% | 7.7% | 19.8% | 35.3% | $4,34 | $10.755,67 | $10.755,67 | 1.0 |

|
||
| 10810 |

Strategic ETH Reserve
SΞR
|
$0,0001053 | 0.0% | 4.5% | 4.5% | 14.7% | $3,90 | $10.531,20 | $10.531,20 | 1.0 |

|
||
| 11024 |

BubbleFlap
BFLAP
|
$0,00001086 | 0.0% | 2.9% | 10.9% | 23.1% | $5,33 | $9.804,77 | $9.804,77 | 1.0 |

|
||
| 11049 |

Deepnets
DNET
|
$0,00001016 | 0.0% | 20.3% | 24.2% | 52.9% | $42,54 | $9.722,18 | $9.722,18 | 1.0 |

|
||
| 11204 |

Dyordotcom
DYOR
|
$0,00001877 | 0.0% | 4.8% | 4.8% | 77.8% | $15,10 | $9.138,38 | $9.138,38 | 0.9999999999999998 |

|
||
| 11226 |

Liquidum
LIDUM
|
$0.059045 | 0.0% | 29.2% | 29.2% | 32.9% | $2,78 | $9.044,88 | $9.044,88 | 1.0 |

|
||
| 11490 |

Arcvein
ARCVEIN
|
$0.058139 | 0.0% | 0.1% | 50.9% | 0.0% | $139,18 | $8.138,89 | $8.138,89 | 1.0 |
|
||
| 11514 |

Exodus AI
EXO
|
$0.058169 | 0.0% | 4.1% | 11.9% | 25.9% | $4,09 | $8.073,65 | $8.073,65 | 1.0 |

|
||
| 11697 |

Trio ICM
TRIO
|
$0.057578 | 0.8% | 13.6% | 23.8% | 30.0% | $3,70 | $7.578,03 | $7.578,03 | 1.0 |

|
||
| 11768 |

Hoodwatch
WATCH
|
$0.057406 | 0.2% | 11.2% | 23.8% | 65.1% | $52,32 | $7.405,54 | $7.405,54 | 1.0 |

|
||
| 11890 |

BelievePad
BPAD
|
$0.057082 | 0.0% | 16.0% | 16.0% | 21.7% | $1,90 | $7.062,76 | $7.062,76 | 1.0 |

|
||
| 12072 |

REPO ANALYZER AI
REPOALYZE
|
$0.056713 | 0.0% | 7.3% | 7.3% | 14.6% | $24,95 | $6.644,71 | $6.710,78 | 0.9901548163052811 |

|
||
| 12099 |

Inferium
IFR
|
$0,00007615 | 0.0% | 4.8% | 11.5% | 7.1% | $4,23 | $6.576,19 | $19.036,88 | 0.3454448337994268 |

|
||
| 12112 |

QuantifyAI
QGG
|
$0.056552 | 0.0% | 3.9% | 0.8% | 19.3% | $1,63 | $6.541,31 | $6.541,31 | 1.0 |

|
||
| 12161 |

Fable
FABLE
|
$0.056972 | 0.0% | 5.9% | 26.3% | 10.0% | $8,67 | $6.425,59 | $6.425,59 | 1.0 |
|
||
| 12170 |

PredicTools
PREDIC
|
$0.056405 | 0.8% | 5.8% | 23.3% | 36.2% | $12,79 | $6.402,00 | $6.402,00 | 1.0 |

|
||
| 12209 |

Chain-Fox
CFX
|
Køb
|
$0.056336 | 0.0% | 0.7% | 8.2% | 13.3% | $2,08 | $6.334,84 | $6.334,84 | 1.0 |

|
|
| 12242 |

Kolytics
KOLT
|
$0,0007840 | 0.0% | 39.8% | 73.3% | 76.6% | $3.101,84 | $6.271,89 | $7.839,87 | 0.8 |

|
||
| 12287 |

BOW
BOW
|
$0.057088 | 0.0% | 3.7% | 16.8% | 26.7% | $3,24 | $6.155,91 | $6.155,91 | 1.0 |

|
||
| 12382 |

VirtuBeauty by Virtuals
VBEA
|
$0.055950 | 0.0% | 5.0% | 17.8% | 31.3% | $4,77 | $5.950,23 | $5.950,23 | 1.0 |

|
||
| 12530 |

We Will Huddle
HUDDLE
|
$0.055725 | 0.0% | 5.2% | 13.5% | 25.9% | $1,64 | $5.673,41 | $5.673,41 | 1.0 |

|
||
| 12697 |

AAAI_agent by Virtuals
AAAI
|
$0.055383 | 0.4% | 27.8% | 27.8% | 45.6% | $117,25 | $5.383,32 | $5.383,32 | 1.0 |

|
||
| 12726 |

Ocula
OCULA
|
$0.055596 | 0.8% | 5.6% | 6.6% | 90.6% | $40,00 | $5.331,84 | $5.331,84 | 1.0 |
|
||
| 12800 |

Kyro Markets
KYRO
|
$0.055190 | 0.1% | 4.4% | 34.2% | 0.0% | $7,29 | $5.189,95 | $5.189,95 | 1.0 |
|
||
| 13048 |

toaster.trade
TOASTER
|
$0.055539 | 0.0% | 21.0% | 21.0% | 21.0% | $1,36 | $4.707,97 | $4.707,97 | 1.0 |

|
||
| 13152 |

Opus The Trencher
OPUS
|
$0.054666 | 0.8% | 5.3% | 25.9% | 36.7% | $3,48 | $4.532,73 | $4.532,73 | 1.0 |

|
||
| 13297 |

ALINA AI
ALINAINTEL
|
$0.054322 | 0.0% | 3.7% | 3.7% | 26.4% | $1,32 | $4.309,92 | $4.309,92 | 1.0 |

|
||
| 13344 |

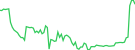
RobinSight
SIGHT
|
$0.054230 | 0.0% | 10.0% | 10.9% | 34.3% | $7,98 | $4.229,74 | $4.229,74 | 1.0 |
|
||
| 13348 |

Degen Social Media
DEGEN
|
$0.054233 | 0.0% | 1.1% | 1.1% | 15.5% | $183,37 | $4.227,19 | $4.227,19 | 1.0 |

|
||
| 13374 |

RiceLabs
RICE
|
$0.054191 | 0.0% | 3.3% | 3.3% | 13.4% | $1,11 | $4.191,17 | $4.191,17 | 1.0 |

|
||
| 13511 |

FutureScanX
FSX
|
$0.054001 | 0.0% | 0.8% | 0.5% | 6.5% | $7,00 | $3.980,77 | $4.000,78 | 0.9949993937545369 |

|
||
| 13628 |

SimiliScan
SMS
|
$0,00003844 | 0.0% | 3.0% | 5.3% | 22.5% | $8,64 | $3.844,49 | $3.844,49 | 1.0 |

|
||
| 13637 |

INVARA Core
INVR
|
$0.054264 | 0.1% | 4.2% | 30.1% | 0.0% | $3,96 | $3.843,58 | $4.263,49 | 0.9015099837412969 |
|
||
| 13670 |

XScouter AI
XSAI
|
$0,007581 | 0.0% | 0.0% | 2.4% | 13.1% | $3,48 | $3.790,31 | $3.790,31 | 1.0 |

|
||
| 13717 |

Julia Swarm Syndicate
JSS
|
$0.053858 | 0.0% | 3.2% | 18.6% | 25.8% | $1,85 | $3.720,44 | $3.720,44 | 1.0 |

|
||
| 13752 |

Sounder Liquidity
SOUNDER
|
$0.053682 | 0.1% | 4.5% | 22.2% | 71.2% | $2,61 | $3.682,41 | $3.682,41 | 1.0 |
|
||
| 13771 |

Super Intelligent Identity
SIMD
|
$0.053647 | 0.0% | 5.0% | 17.0% | 95.4% | $72,82 | $3.647,34 | $3.647,34 | 1.0 |
|
||
| 13836 |

HUME MARKETS
HUME
|
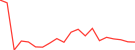
$0.053554 | 0.0% | 2.1% | 28.7% | 89.8% | $1,18 | $3.554,18 | $3.554,18 | 1.0 |
|
||
| 13935 |

DexChart
CHART
|
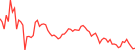
$0.053445 | 0.0% | 4.0% | 1.3% | 18.1% | $2,63 | $3.444,95 | $3.444,95 | 1.0 |
|
||
| 14007 |

Thesis AI
THESIS
|
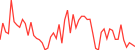
$0.053357 | 0.0% | 2.2% | 79.6% | 96.6% | $7,66 | $3.357,26 | $3.357,26 | 1.0 |
|
||
| 14193 |

0xsim by Virtuals
SAGE
|
$0.053137 | 0.4% | 8.4% | 20.7% | 36.5% | $5,46 | $3.137,00 | $3.137,00 | 1.0 |

|
||
| 14223 |

AstheraFi
ASTHER
|
$0.053107 | 0.0% | 7.8% | 7.8% | 12.4% | $8,06 | $3.107,11 | $3.107,11 | 1.0 |

|
||
| 14298 |

Grail
GRAIL
|
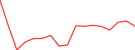
$0.053352 | 0.0% | 7.4% | 1.4% | 62.6% | $3,88 | $3.021,79 | $3.021,79 | 1.0 |
|
||
| 14434 |

VoidScreener
VOID
|
$0.052895 | 0.0% | 13.7% | 13.7% | 15.5% | $6,90 | $2.876,09 | $2.876,09 | 1.0 |

|
||
| 14571 |

Quanta
QNTA
|
$0.052794 | 0.0% | 4.1% | 9.6% | 23.1% | $1,49 | $2.737,97 | $2.737,97 | 1.0 |
|
||
| 14575 |

Lashi
LASHI
|
$0.052735 | 0.0% | 6.3% | 6.3% | 27.5% | $1,50 | $2.734,94 | $2.734,94 | 1.0 |

|
||
| 14759 |

BubbleLabs
BUBBLE
|
$0.052632 | 0.0% | 5.9% | 5.9% | 5.9% | $3,64 | $2.552,76 | $2.552,76 | 1.0 |

|
||
| 14825 |

SWARM ENGINE
SWARM
|
$0.052504 | 0.0% | 3.1% | 16.3% | 93.5% | $2,90 | $2.486,59 | $2.486,59 | 1.0 |
|
||
| 14955 |

Glint
$GLINT
|
$0.073346 | 0.0% | 30.1% | 46.3% | 0.0% | $401,86 | $2.342,52 | $3.346,46 | 0.7000000000000001 |

|
||
| 14963 |

MCAPS
MCAPS
|
$0.052337 | 0.0% | 7.4% | 18.4% | 99.1% | $36,69 | $2.336,75 | $2.336,75 | 1.0 |
|
||
| 15005 |

Raindrop
RAIN
|
Køb
|
$0.052272 | 0.0% | 2.5% | 11.7% | 24.6% | $2,26 | $2.271,28 | $2.271,28 | 1.0 |

|
|
| 15094 |

Lens
LENS
|
$0.052195 | 0.0% | 7.6% | 8.2% | 73.3% | $39,12 | $2.154,83 | $2.194,48 | 0.981932825344961 |

|
||
| 15135 |

sinex
SINX
|
$0.061206 | 0.0% | 3.4% | 3.4% | 31.2% | $1,03 | $2.082,37 | $2.082,37 | 1.0 |

|
||
| 15218 |

Pantheon
PNTH
|
$0.051962 | 0.0% | 4.0% | 22.1% | 28.4% | $10,96 | $1.961,79 | $1.961,79 | 1.0 |

|
||
| 15329 |

Alpha Lens X
ALPHAX
|
$0.051829 | 0.0% | 21.0% | 21.0% | 21.0% | $4,58 | $1.759,76 | $1.759,76 | 1.0 |

|
||
| 15524 |

Attention Trade
ATTN
|
$0.067799 | 0.0% | 23.1% | 23.1% | 44.7% | $1,52 | $951,55 | $951,55 | 1.0 |

|
||
| 15597 |

Shitcoinscreener
SCREENER
|
$0.051719 | 0.0% | 58.0% | 58.0% | 58.0% | $152,81 | $648,77 | $1.719,38 | 0.3773250482452647 |

|
||
| 15752 |

Diverge Loop
DLC
|
$0.063018 | 0.0% | 99.5% | 99.5% | 99.7% | $1,81 | $268,56 | $301,76 | 0.89 |

|
||

KROWN
KRW
|
$0.051868 | 0.2% | 0.9% | 15.6% | 46.0% | $166,15 | - | $18.681,43 |

|
||||

XTTA
XTTA
|
$0,006143 | 0.0% | 0.8% | 20.6% | 54.4% | $3.530,79 | - | $1.963.743 |

|
||||

Inery
$INR
|
$0,0004408 | 0.0% | 1.2% | 1.2% | 2.3% | $1,98 | - | $352.651 |

|
||||

DataPort Navigator by Virtuals
PORT
|
$0,00002216 | 0.0% | 6.4% | 11.1% | 30.8% | $3,48 | - | $22.164,14 |

|
||||

AXiS ALiVE
AXIS
|
$294,20 | 0.6% | 3.7% | 0.7% | 15.0% | $188,80 | - | $294.203.158 |

|
||||

Centcex
CENX
|
$0,00005499 | 0.3% | 3.1% | 15.4% | 19.9% | $139,34 | - | $549.852 |

|
||||

Sypool
SYP
|
$0,00006534 | 0.0% | 2.6% | 14.8% | 19.4% | $101,54 | - | $65.336,18 |

|
||||

CyberHarbor
CHT
|
$0,00005579 | 0.0% | 0.4% | 0.0% | 50.7% | $70,98 | - | $55.791,03 |

|
||||

Ness Lab
NESS
|
$0,001506 | 0.0% | 0.5% | 15.2% | 39.3% | $11.300,79 | - | - |

|
||||

Reflecto
RTO
|
$0.096892 | 0.0% | 1.4% | 5.4% | 16.3% | $47,49 | - | $689.150 |

|
||||

Pullix
PLX
|
$0,0006227 | 0.0% | 3.3% | 15.4% | 19.2% | $2,11 | - | $124.539 |

|
||||

AltsDaddy
DDY
|
$0,00 | - | - | - | - | - | - | - |

|
||||

Bitcoin Silver AI
BSAI
|
$1.632,71 | 0.0% | 0.1% | 0.1% | 13.0% | $153.581 | - | $1.632.707.168.848 |

|
||||

Trading Views
TRADINGVIEWS
|
$0,00 | - | - | - | - | - | - | - |

|
||||
Viser 101 til 200 af 207 resultater
Rækker
Førende Analyser Coins Markedsværdi Diagram
Diagrammet nedenfor viser markedsværdi og dominans på tværs af førende Analyser kryptosektorer, inklusive Pyth Network, The Graph, SoSoValue og andre over en periode.
Førende Analyser Coins præstationsdiagram
Diagrammet nedenfor viser de relative resultater for førende Analyser coins over tid, idet de følger deres procentvise gevinster og tab i form markedsværdi på tværs af forskellige perioder.


 Eller tjek den ud i app-butikkerne