





Portfolios
Add to New Portfolio


cSigma Finance
SIGMA / CAD
CA$0.01018
13.7%
$0.00
24h Range
$0.00


Get SIGMA Alerts within the CoinGecko app

According to GoPlus, this is a proxy contract. The contract owner can make code changes to the token contract including but not limited to disabling sells, changing fees, minting, transferring tokens etc. Exercise caution.
Convert cSigma Finance to Canadian Dollar (SIGMA to CAD)
The price of converting 1 cSigma Finance (SIGMA) to CAD is CA$0.01017773 today.
SIGMA
CAD
1 SIGMA = CA$0.01017773
How to Buy SIGMA with CAD
Show-
1. Identify where to trade SIGMA
-
cSigma Finance (SIGMA) can be bought and sold across 1 crypto exchanges. Based on trading volume and Trust Score, the most active exchange to trade SIGMA is Uniswap V4 (Ethereum).
-
2. Choose a suitable exchange
-
A popular option to buy SIGMA is through a decentralized exchange (DEX). When choosing a DEX, compare its liquidity, security and available assets. Most DEXes have network and trading fees, so remember to allocate some funds for this.
-
3. Buy a base cryptocurrency with CAD
-
Once you’ve identified a preferred DEX, you’ll need to buy a popular cryptocurrency such as Ethereum or Stablecoins from a centralized exchange (CEX) that accepts CAD. This is important as you’ll be using this as a base cryptocurrency.
-
4. Setup a crypto wallet
-
Transfer the base cryptocurrency to a crypto wallet. Setting up a crypto wallet such as MetaMask enables you to control your private keys and manage all assets in one place. Store your private keys somewhere safe & easily accessible.
-
5. You’re now ready to buy SIGMA!
-
Connect your crypto wallet to a preferred DEX. On the exchange, select cSigma Finance (SIGMA) and enter the amount of crypto you’d like to trade. Verify the details before confirming the transaction.
SIGMA to CAD Chart
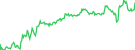
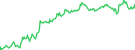
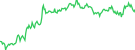
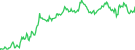
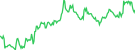
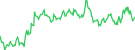
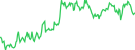
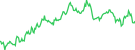
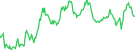
cSigma Finance (SIGMA) is worth CA$0.01017773 today, which is a 0.0% decline from an hour ago and a 13.7% decline since yesterday. The value of SIGMA today is 17.5% lower compared to its value 7 days ago. In the last 24 hours, the total volume of cSigma Finance traded was CA$4,864.82.
Use log scale
View in full screen
Download as PNG
Download as SVG
Download as JPEG
Download as PDF
View in full screen
Comparison is only available on line charts.
Switch & Compare
Switch & Compare
Need more data?
Explore our API
| 1h | 24h | 7d | 14d | 30d | 1y |
|---|---|---|---|---|---|
| 0.0% | 13.7% | 17.5% | 28.2% | 29.0% | 0.0% |
cSigma Finance Statistics
| Market Cap | CA$0.00 |
|---|---|
| Market Cap / FDV | 0 |
| Fully Diluted Valuation | CA$10.178M |
| 24 Hour Trading Vol | CA$4,864.82 |
| Circulating Supply | - |
| Total Supply | 1B |
| Max Supply | 1B |
Buy / Sell
 Sponsored
Wallet
Sponsored
Earn Crypto
Sponsored
FAQs
-
How much is 1 cSigma Finance worth in CAD?
- As of now, the price of 1 cSigma Finance (SIGMA) in Canadian Dollar (CAD) is about CA$0.01018.
-
How many SIGMA can I buy for CA$1?
- You can buy approximately 98.25 SIGMA for CA$1 today.
-
How do I convert the price of SIGMA to CAD?
- Calculate cSigma Finance's price in Canadian Dollar by inputting your desired amount on CoinGecko’s SIGMA to CAD converter. Track its historical price movements on the SIGMA to CAD chart, and explore more crypto prices in CAD.
-
What is the highest price of SIGMA/CAD in history?
- The all-time high price of 1 SIGMA in CAD is CA$0.2636. It remains to be seen if the value of 1 SIGMA/CAD will exceed the current all-time high.
-
What is the price trend of cSigma Finance in CAD?
- In recent times, the price of cSigma Finance (SIGMA) has remained stationary against the Canadian Dollar (CAD). In fact, the price of SIGMA/CAD has not moved in the last 24 hours signaling a potential period of stagnation.
SIGMA / CAD Conversion Tables
The conversion rate of cSigma Finance (SIGMA) to CAD is CA$0.01017773 for every 1 SIGMA. This means you can exchange 5 SIGMA for CA$0.050889 or CA$50.00 for 4912.69 SIGMA, excluding fees. Refer to our conversion tables for popular SIGMA trading amounts in their corresponding CAD prices and vice versa.
Convert cSigma Finance (SIGMA) to CAD
| SIGMA | CAD |
|---|---|
| 0.01 SIGMA | 0.00010178 CAD |
| 0.1 SIGMA | 0.00101777 CAD |
| 1 SIGMA | 0.01017773 CAD |
| 2 SIGMA | 0.02035546 CAD |
| 5 SIGMA | 0.050889 CAD |
| 10 SIGMA | 0.101777 CAD |
| 20 SIGMA | 0.203555 CAD |
| 50 SIGMA | 0.508886 CAD |
| 100 SIGMA | 1.018 CAD |
| 1000 SIGMA | 10.18 CAD |
Convert Canadian Dollar (CAD) to SIGMA
| CAD | SIGMA |
|---|---|
| 0.01 CAD | 0.982537 SIGMA |
| 0.1 CAD | 9.83 SIGMA |
| 1 CAD | 98.25 SIGMA |
| 2 CAD | 196.51 SIGMA |
| 5 CAD | 491.27 SIGMA |
| 10 CAD | 982.54 SIGMA |
| 20 CAD | 1965.07 SIGMA |
| 50 CAD | 4912.69 SIGMA |
| 100 CAD | 9825.37 SIGMA |
| 1000 CAD | 98254 SIGMA |
7-day price history of cSigma Finance (SIGMA) to CAD
cSigma Finance (SIGMA) is currently valued at CA$0.01017773 and has experienced very few price movements in the last 7 days. Within the week, the highest daily exchange rate of SIGMA was CA$0.01017773 on Thursday, and the largest 24-hour price movement was -CA$0.00161181 (13.7%) on Thursday.
| Date | Day of the week | 1 SIGMA to CAD | 24hr Changes | Change % |
|---|---|---|---|---|
| October 15, 2026 | Thursday | CA$0.01017773 | -CA$0.00161181 | 13.7% |
| October 14, 2026 | Wednesday | N/A | N/A | 0.0% |
| October 13, 2026 | Tuesday | N/A | N/A | 0.0% |
| October 12, 2026 | Monday | N/A | N/A | 0.0% |
| October 11, 2026 | Sunday | N/A | N/A | 0.0% |
| October 10, 2026 | Saturday | N/A | N/A | 0.0% |
| October 09, 2026 | Friday | N/A | N/A | 0.0% |


























 Or check it out in the app stores



