




PlotX
PLOT / ZAR


Convert PlotX PLOT to South African Rand ZAR
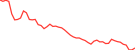
PLOT to ZAR Chart
Switch & Compare
| 1h | 24h | 7d | 14d | 30d | 1y |
|---|---|---|---|---|---|
| 0.0% | 2.7% | 7.7% | 10.0% | 15.8% | 47.8% |
PlotX Statistics
| Market Cap | R5.194M |
|---|---|
| Market Cap / FDV | 0.52 |
| Fully Diluted Valuation | R9.964M |
| 24 Hour Trading Vol | R7,960.00 |
| Circulating Supply | 104.247M |
| Total Supply | 200M |
| Max Supply | 200M |
 Sponsored
Sponsored
PLOT / ZAR Conversion Tables
PLOT to ZAR
| PLOT | ZAR |
|---|---|
| 0.01 PLOT | 0.00049819 ZAR |
| 0.1 PLOT | 0.00498194 ZAR |
| 1 PLOT | 0.04981943 ZAR |
| 2 PLOT | 0.099639 ZAR |
| 5 PLOT | 0.249097 ZAR |
| 10 PLOT | 0.498194 ZAR |
| 20 PLOT | 0.996389 ZAR |
| 50 PLOT | 2.49 ZAR |
| 100 PLOT | 4.98 ZAR |
| 1000 PLOT | 49.82 ZAR |
| 10000 PLOT | 498.19 ZAR |
| 100000 PLOT | 4981.94 ZAR |
ZAR to PLOT
| ZAR | PLOT |
|---|---|
| 0.01 ZAR | 0.200725 PLOT |
| 0.1 ZAR | 2.01 PLOT |
| 1 ZAR | 20.07 PLOT |
| 2 ZAR | 40.14 PLOT |
| 5 ZAR | 100.36 PLOT |
| 10 ZAR | 200.72 PLOT |
| 20 ZAR | 401.45 PLOT |
| 50 ZAR | 1003.62 PLOT |
| 100 ZAR | 2007.25 PLOT |
| 1000 ZAR | 20072 PLOT |
| 10000 ZAR | 200725 PLOT |
| 100000 ZAR | 2007249 PLOT |
PLOT / ZAR 7-day Price History
Get PLOT Price on:
| Date | Day of the week | 1 PLOT to ZAR | 24hr Changes | Change % |
|---|---|---|---|---|
| 2026-11-11 | Wednesday | R0.04981943 | -R0.00136893 | 2.7% |
| 2026-11-10 | Tuesday | R0.04985566 | -R0.00102969 | 2.0% |
| 2026-11-09 | Monday | R0.050885 | -R0.00049667 | 1.0% |
| 2026-11-08 | Sunday | R0.051382 | -R0.00180894 | 3.4% |
| 2026-11-07 | Saturday | R0.053191 | -R0.00030896 | 0.6% |
| 2026-11-06 | Friday | R0.053500 | R0.00034358 | 0.6% |
| 2026-11-05 | Thursday | R0.053156 | -R0.00327387 | 5.8% |
Institutional & Enterprise Trust



Frequently Asked Questions
-
How much is 1 PlotX worth in ZAR?
- As of now, the price of 1 PlotX (PLOT) in South African Rand (ZAR) is about R0.04982.
-
How many PLOT can I buy for R1?
- You can buy approximately 20.07 PLOT for R1 today.
-
How do I convert the price of PLOT to ZAR?
- Calculate PlotX's price in South African Rand by inputting your desired amount on CoinGecko’s PLOT to ZAR converter. Track its historical price movements on the PLOT to ZAR chart, and explore more crypto prices in ZAR.
-
What is the highest price of PLOT/ZAR in history?
- The all-time high price of 1 PLOT in ZAR is R5.55. It remains to be seen if the value of 1 PLOT/ZAR will exceed the current all-time high.
-
What is the price trend of PlotX in ZAR?
- Over the last month, the price of PlotX (PLOT) has gone down by -15.80% against the South African Rand (ZAR). In fact, PlotX has underperformed against the broader crypto market, which is down by -13.10%.
-
How to buy PLOT with ZAR?
-
1. Identify where to trade PLOT
PlotX (PLOT) can be bought and sold across 4 crypto exchanges. Based on trading volume and Trust Score, the most active exchange to trade PLOT is Uniswap V3 (Ethereum), followed by Uniswap V2 (Ethereum).2. Choose a suitable exchange
A popular option to buy PLOT is through a decentralized exchange (DEX). When choosing a DEX, compare its liquidity, security and available assets. Most DEXes have network and trading fees, so remember to allocate some funds for this.3. Buy a base cryptocurrency with ZAR
Once you’ve identified a preferred DEX, you’ll need to buy a popular cryptocurrency such as Ethereum or Stablecoins from a centralized exchange (CEX) that accepts ZAR. This is important as you’ll be using this as a base cryptocurrency.4. Setup a crypto wallet
Transfer the base cryptocurrency to a crypto wallet. Setting up a crypto wallet such as MetaMask enables you to control your private keys and manage all assets in one place. Store your private keys somewhere safe & easily accessible.5. You’re now ready to buy PLOT!
Connect your crypto wallet to a preferred DEX. On the exchange, select PlotX (PLOT) and enter the amount of crypto you’d like to trade. Verify the details before confirming the transaction. -
Can I get historical PLOT prices in ZAR via API?
- Yes. Get PLOT's historical price in South African Rand using GET /coins/plotx/history for a single date, or GET /coins/plotx/market_chart/range?vs_currency=zar for a range. Both endpoints are available on the free CoinGecko API Demo plan, though rate limits apply.
-
How is PLOT/ZAR price calculated on CoinGecko?
- PLOT/ZAR is calculated by first determining PlotX's price in USD, using our in-house volume-weighted average methodology. This USD price is then converted to ZAR using the latest USD/ZAR exchange rate. Learn more about how crypto prices are calculated on CoinGecko.
-
Is CoinGecko API's data suitable for institutional or regulated use?
- Yes. The CoinGecko API is SOC 2 Type II certified, offers a 99.9% uptime SLA, and provides custom data licensing for institutional needs like fund valuations and regulated reporting (FASB, IFRS). Check out our Enterprise plan for more information.




 Or check it out in the app stores