





Carteras
Añadir a la nueva cartera

Seguir
![]() vaya donde vaya
Reciba las novedades en tiempo real mediante notificaciones push en la aplicación.
Abrir aplicación
Las principales monedas Plataforma de contrato inteligente según la capitalización de mercado
La capitalización de mercado de Plataforma de contrato inteligente hoy es de 1,7 billón $, lo que supone un cambio del -5.6% en las últimas 24 horas.
Lo más destacado
$1.701.502.054.632
Cap. mercado
5.3%

$91.652.254.029
Volumen en 24 horas


| # | Moneda | Precio | 1 h | 24 h | 7 d | 30 d | Volumen en 24 h | Cap. de mercado | FDV | Cap. de mercado/FDV | Últimos 7 días | ||
|---|---|---|---|---|---|---|---|---|---|---|---|---|---|

Cedra Network
$CED
|
$0,00 | - | - | - | - | - | - | - |

|
||||

CoNET Network
CONET
|
$0,00 | - | - | - | - | - | - | - |

|
||||

Unit Network
UNIT
|
$0,00 | - | - | - | - | - | - | - |

|
||||

Quranium
QRN
|
$0,00 | - | - | - | - | - | - | - |

|
||||

ZkCloud
PROOF
|
$0,00 | - | - | - | - | - | - | - |

|
||||

BlockX
BCX
|
$0,00 | - | - | - | - | - | - | - |

|
||||

UraniumX
URX
|
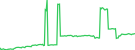
$0,5864 | 0.0% | 0.8% | 12.7% | 27.5% | $0,1231 | - | $137.799 |
|
||||

Newton
NTN
|
$0,00 | - | - | - | - | - | - | - |

|
||||

HeliChain
HELI
|
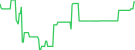
$0.054196 | 0.0% | 0.0% | 18.2% | 15.8% | $0,7478 | - | - |
|
||||

Qitcoin
QTC
|
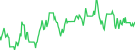
$0,0003813 | 0.0% | 24.5% | 38.2% | 68.2% | $457,28 | - | $40.036,29 |
|
||||

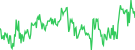
Nengcoin
NENG
|
$0.064577 | 0.6% | 9.2% | 0.9% | 18.5% | $147,30 | - | - |
|
||||

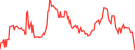
Locus Chain
LOCUS
|
$0,003391 | 0.1% | 3.5% | 27.2% | 36.5% | $65.933,43 | - | $23.737.068 |
|
||||

Siriusnet
SINT
|
$0,00 | - | - | - | - | - | - | - |

|
||||

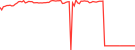
Snowman
SNOW
|
$0.0106368 | 0.0% | 22.6% | 2.2% | 8.0% | $229,73 | - | $56.601,22 |
|
||||

Cubechain
QUB
|
$0,00 | - | - | - | - | - | - | - |

|
||||

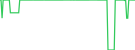
ZHC : Zero Hour Cash
ZHC
|
$0,001328 | 0.0% | 0.0% | 0.0% | 13.4% | $0,02108 | - | $398.378 |
|
||||

Auton
ATN
|
$0,00 | - | - | - | - | - | - | - |

|
||||

Tangle Network
TNT
|
$0,00 | - | - | - | - | - | - | - |

|
||||

Meta Finance Elements Verse
MFEV
|
$0,00 | - | - | - | - | - | - | - |

|
||||

Sardis Network
SRDS
|
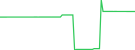
$0,005023 | 4.8% | 4.6% | 0.2% | 20.7% | $154,98 | - | $1.577.867 |
|
||||

wanXRP
WANXRP
|
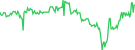
$0,7282 | 0.5% | 6.5% | 26.3% | 47.7% | $245,72 | - | $506.555 |
|
||||

STO Chain
STOC
|
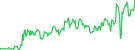
$0,8768 | 0.0% | 0.1% | 0.2% | 1.7% | $151.794 | - | - |
|
||||

Americoin
AMC
|
$0,00 | - | - | - | - | - | - | - |

|
||||

Safrochain SAF token
SAF
|
$0,00 | - | - | - | - | - | - | - |

|
||||

Oxin
OXIN
|
$0,00 | - | - | - | - | - | - | - |

|
||||

GGEZ1
GGEZ1
|
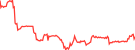
$0,08861 | 0.5% | 0.3% | 1.4% | 0.3% | $64.393,64 | - | $157.534.849 |
|
||||

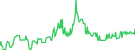
BTCMobick
BMB
|
$74,86 | 0.0% | 9.5% | 12.4% | 35.5% | $45.880,61 | - | $2.853.324.614 |
|
||||

HarvestAI
BTH
|
$0,00 | - | - | - | - | - | - | - |

|
||||

Vecno
VE
|
$0,00 | 0.0% | 0.0% | 0.0% | 0.0% | - | - | - |

|
||||

Panjea
PANJ
|
$0,00 | - | - | - | - | - | - | - |

|
||||

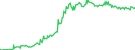
TEXITcoin
TXC
|
$0,08464 | 0.4% | 1.2% | 11.9% | 23.6% | $467,60 | - | $8.294.959 |
|
||||

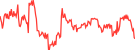
Mixin
XIN
|
$38,19 | 0.4% | 4.6% | 12.3% | 26.6% | $26.589,30 | - | $38.186.571 |
|
||||

xBear Network
XBEAR
|
$0,00 | - | - | - | - | - | - | - |

|
||||

Meta Earth
MEC
|
$0,00 | - | - | - | - | - | - | - |

|
||||

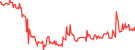
SymVerse
SYMM
|
$0,02110 | 0.0% | 27.2% | 38.9% | 52.0% | $1.110,80 | - | $5.514.092 |
|
||||

GOSH
GOSH
|
$0,00 | - | - | - | - | - | - | - |

|
||||

Krown Network
KROWN
|
$0,00005654 | 0.8% | 1.3% | 8.6% | 28.1% | $73.620,25 | - | $5.654.494 |

|
||||

GenLayer
GEN
|
$0,00 | - | - | - | - | - | - | - |

|
||||

Vitreus
WVTRS
|
$0,005061 | 0.0% | 0.9% | 2.9% | 6.9% | $499,07 | - | $3.080.826 |

|
||||

Gonka
GNK
|
$0,1397 | 0.0% | 6.3% | 6.3% | 25.1% | $11.437,88 | - | $60.688.585 |
|
||||

UNIVEX
UVX
|
$0,00 | - | - | - | - | - | - | - |

|
||||

COTI Governance Token
GCOTI
|
$0,0003180 | 0.0% | 6.0% | 56.4% | 28.9% | $2,93 | - | $317.969 |
|
||||

WABA
WABA
|
$0,0004241 | 0.0% | 2.1% | 22.0% | 37.6% | $67,47 | - | $424.108 |

|
||||

Telcoin [OLD]
TEL
|
Comprar
|
$0,001384 | 0.2% | 5.4% | 3.2% | 3.9% | $121.006 | - | $138.415.476 |
|
|||

Sweets
SWEETS
|
$0,00 | - | - | - | - | - | - | - |

|
||||

Orbition Network
OBN
|
$0,00 | - | - | - | - | - | - | - |

|
||||

Jupiter Meta Data Token
JMDT
|
$0,3245 | 4.4% | 72.0% | 72.3% | 72.6% | $1.673,99 | - | $324.497.071 |
|
||||

OroBit
XRB
|
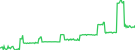
$1,48 | 0.3% | 2.9% | 14.1% | 7.6% | $85.428,04 | - | $741.472.313 |
|
||||

Bloch
BLCH
|
$0,00 | - | - | - | - | - | - | - |

|
||||

BDTCOIN
BDTC
|
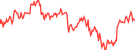
$0,03796 | 0.0% | 35.6% | 95.5% | 99.4% | $440,34 | - | $1.603.175 |
|
||||

ZKcandy
CANDY
|
$0,00 | - | - | - | - | - | - | - |

|
||||

Nyks
NYKS
|
$0,00 | - | - | - | - | - | - | - |

|
||||

Numen
NUMN
|
$0,00 | - | - | - | - | - | - | - |

|
||||

Mandala
KPG
|
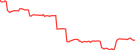
$0,001206 | 0.1% | 7.7% | 11.6% | 28.3% | $1,16 | - | $1.205.706 |
|
||||

HyperCycle
HYPC
|
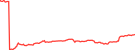
$0,002283 | 0.1% | 7.6% | 19.5% | 43.2% | $2,32 | - | $4.902.654 |
|
||||

Arc
ARC
|
$0,00 | - | - | - | - | - | - | - |

|
||||

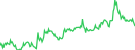
Tap Protocol
TAP
|
$0,04368 | 1.1% | 1.5% | 9.0% | 5.4% | $7.158,80 | - | $917.294 |
|
||||

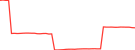
AILayer Token
AIL
|
$0,00003387 | 0.0% | 79.2% | 79.8% | 81.4% | $129,11 | - | $33.871,10 |
|
||||

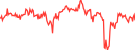
ArchLoot
AL
|
$0,001194 | 0.6% | 1.7% | 2.6% | 17.3% | $47.346,11 | - | $1.185.494 |
|
||||

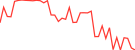
Tajir
TJR
|
$0,3482 | 0.0% | 1.5% | 1.3% | 2.1% | $2.853,69 | - | $226.337.756 |
|
||||

Xsolla Gas
XLA
|
$0,9601 | 0.1% | 2.4% | 0.0% | 0.0% | $1.036.889 | - | $960.114.695 |

|
||||
Mostrando resultados 801 a 861 de un total de 861
Filas
Categorías Plataforma de contrato inteligente
| Nombre | 24 h | Cap. de mercado |
|---|---|---|
|
Todas las Plataforma de contrato inteligente
|
5.6%
|
$1.697.018.677.242
|
|
Capa 1 (L1)
|
5.5%
|
|
|
Proof Of Work Pow
|
5.1%
|
|
|
Proof Of Stake Pos
|
6.9%
|
|
|
Conocimiento cero (ZK)
|
13.7%
|
|
|
Capa 2 (L2)
|
6.2%
|
|
|
Privacy Blockchain
|
5.5%
|
|
|
Layer 0 L0
|
6.5%
|
|
|
Superchain Ecosystem
|
8.8%
|
|
|
Sidechain
|
6.8%
|
|
|
Gaming Blockchains
|
5.8%
|
|
Gráfico de cap. de mercado de los principales sectores de Plataforma de contrato inteligente
El siguiente gráfico muestra la capitalización de mercado y el dominio en las subcategorías Plataforma de contrato inteligente, entre ellas Capa 1 (L1), Proof Of Work Pow, etc. durante un periodo de tiempo.
Gráfico de rendimiento de los mayores sectores de Plataforma de contrato inteligente
El siguiente gráfico muestra el rendimiento relativo de las subcategorías Plataforma de contrato inteligente a lo largo del tiempo. Pare ello, tiene en cuenta sus ganancias y pérdidas porcentuales en términos de capitalización de mercado en diferentes periodos.
Últimas noticias de Plataforma de contrato inteligente

 ETH

 BTC


 USDC




 O búsquela en las tiendas de aplicaciones



