





Portefeuilles
Toevoegen aan nieuwe portefeuille


Top Analyse-munten op marktkapitalisatie
De marktkapitalisatie van Analyse is vandaag $ 1,6 miljard, een verandering van 1.7% in de afgelopen 24 uur.
Hoogtepunten
$1.601.949.565
Marktkap.
1.8%

$162.235.786
24 uur handelsvolume


| # | Munt | Koers | 1u | 24u | 7d | 30d | 24 uur volume | Marktkapitalisatie | FDV | Marktkapitalisatie/FDV | Afgelopen 7 dagen | ||
|---|---|---|---|---|---|---|---|---|---|---|---|---|---|
| 7187 |

ChainAware.ai
AWARE
|
$0,0008482 | 0.0% | 5.4% | 2.1% | 2.7% | $227,46 | $35.845,14 | $84.818,80 | 0.42260845365164657 |

|
||

AInalyst
AIN
|
$0,00003389 | 0.0% | 5.9% | 4.2% | 23.4% | $15,91 | $33.892,13 | $33.892,13 | 1.0 |

|
|||
| 7354 |

Pentagon Pizza Watch
PPW
|
$0,00003219 | 1.4% | 1.3% | 13.3% | 10.6% | $126,29 | $32.185,57 | $32.185,57 | 1.0 |

|
||

Tradescoop by Virtuals
SCOOP
|
$0,00003037 | 0.0% | 0.2% | 2.3% | 11.6% | $1,73 | $30.366,70 | $30.366,70 | 1.0 |

|
|||
| 7595 |

SubQuery Network
SQT
|
$0.057298 | 0.0% | 4.3% | 22.1% | 33.3% | $112,21 | $27.637,28 | $74.548,61 | 0.37072824608878086 |

|
||

opensvm.com
SVMAI
|
$0,00002731 | 0.0% | 0.2% | 6.4% | 13.3% | $161,12 | $27.296,96 | $27.296,96 | 1.0 |

|
|||
| 7629 |

ReVault
RVAULT
|
$0.062710 | 0.1% | 0.7% | 3.1% | 13.3% | $9,60 | $27.097,58 | $27.097,58 | 1.0 |

|
||
| 7638 |

Ocula
OCULA
|
$0,00002829 | 0.1% | 28.1% | 17.6% | 55.2% | $2.134,95 | $26.953,52 | $26.953,52 | 1.0 |
|
||

Helio
HELIO
|
$0,00002748 | 0.0% | 4.3% | 5.1% | 16.8% | $2,42 | $25.349,04 | $25.349,04 | 1.0 |

|
|||
| 7737 |

UpScalp
UPSCALP
|
$0,00002819 | 0.1% | 9.4% | 11.2% | 33.4% | $389,62 | $25.278,64 | $28.181,78 | 0.8969851681456672 |

|
||
| 7763 |

gemxbt
GEMXBT
|
$0,00002630 | 0.1% | 2.3% | 3.8% | 19.1% | $30,27 | $24.973,79 | $24.973,79 | 1.0 |

|
||
| 7866 |

DigitalDon
DON
|
$0,00002295 | 0.0% | 0.3% | 15.2% | 1.5% | $129,48 | $22.953,81 | $22.953,81 | 1.0 |
|
||
| 7886 |

TetraScore
SCORE
|
$0,00002266 | 0.1% | 5.4% | 0.8% | 0.0% | $24,76 | $22.657,59 | $22.657,59 | 1.0 |
|
||

Velvet AI
VELAI
|
$0,00002036 | 0.0% | 7.7% | 7.7% | 40.9% | $2,21 | $22.495,77 | $22.495,77 | 1.0 |

|
|||
| 7950 |

Mind AI
MA
|
$0,00004784 | 0.0% | 3.4% | 27.6% | 15.1% | $434,94 | $21.678,74 | $23.919,65 | 0.9063152005010608 |

|
||

Navigate
NVG8
|
$0,00008374 | 0.0% | 0.8% | 0.8% | 9.4% | $2,05 | $21.128,81 | $83.741,27 | 0.25231056655503403 |

|
|||

Hyperbot
BOT
|
$0,0001552 | 0.0% | 4.0% | 39.3% | 36.9% | $63,57 | $19.533,36 | $155.232 | 0.125833333 |

|
|||
| 8134 |

Kyro Markets
KYRO
|
$0,00001884 | 1.5% | 52.8% | 0.0% | 0.0% | $7.325,62 | $18.839,41 | $18.839,41 | 1.0 |
|
||

Melvin
MEL
|
$0,00001808 | 0.0% | 4.8% | 30.0% | 21.0% | $2,13 | $18.081,20 | $18.081,20 | 1.0 |

|
|||
| 8249 |

Checkr
$CHECKR
|
$0.066016 | 0.1% | 1.0% | 4.7% | 36.8% | $119,17 | $17.377,91 | $58.058,48 | 0.2993173407514131 |

|
||
| 8253 |

Deepnets
DNET
|
$0,00001805 | 0.0% | 0.6% | 4.8% | 25.4% | $7,26 | $17.316,75 | $17.316,75 | 1.0 |

|
||
| 8308 |

PATRIOT
PATRIOT
|
$0,00001655 | 0.0% | 0.0% | 5.4% | 24.3% | $1,42 | $16.545,87 | $16.545,87 | 1.0 |

|
||

ComputeBase
COMPUTE
|
$0.061649 | 0.0% | 3.6% | 3.2% | 10.8% | $3,38 | $16.494,94 | $16.494,94 | 1.0 |

|
|||
| 8332 |

SYLVI AGENT
SYLVIAI
|
$0,00001632 | 0.1% | 0.4% | 5.2% | 19.0% | $1,24 | $16.321,23 | $16.321,23 | 1.0 |

|
||

Prometheus
PROMETHEUS
|
$0,00003217 | 0.0% | 25.3% | 25.3% | 5.7% | $5,78 | $16.085,22 | $32.172,93 | 0.4999614075370567 |

|
|||
| 8403 |

Anti Rug Agent
ANTIRUG
|
$0,00001525 | 0.1% | 0.6% | 7.8% | 12.6% | $8,95 | $15.248,52 | $15.248,52 | 1.0 |

|
||

Generative Market eXplorer
AIGMX
|
$0,00001504 | 0.0% | 1.7% | 9.5% | 22.1% | $1,74 | $15.036,34 | $15.036,34 | 1.0 |

|
|||

Omnis Genesis by Virtuals
OMNI
|
$0,00001730 | 0.0% | 0.5% | 4.0% | 7.1% | $1,51 | $14.614,96 | $14.614,96 | 1.0 |

|
|||

HooderScan
HOODER
|
$0,00001675 | 0.0% | 49.2% | 92.6% | 70.6% | $1.062,53 | $12.560,66 | $16.747,55 | 0.75 |

|
|||

BelieveScreener
BSCREENER
|
$0,00001237 | 0.0% | 1.0% | 14.7% | 15.1% | $1,00000 | $12.367,35 | $12.367,35 | 1.0 |

|
|||
| 8727 |

BubbleFlap
BFLAP
|
$0,00001355 | 0.1% | 0.8% | 3.6% | 15.2% | $39,83 | $12.239,68 | $12.239,68 | 1.0 |

|
||
| 8758 |

Hoodwatch
WATCH
|
$0,00001201 | 0.1% | 4.2% | 36.4% | 56.8% | $13,69 | $12.007,55 | $12.007,55 | 1.0 |

|
||
| 8820 |

INVARA Core
INVR
|
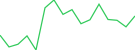
$0,00001278 | 15.9% | 23.5% | 90.5% | 0.0% | $7.119,49 | $11.524,19 | $12.783,21 | 0.9015099837412968 |
|
||
| 8838 |

HUME MARKETS
HUME
|
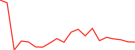
$0,00001134 | 15.4% | 51.7% | 165.6% | 0.0% | $4.153,53 | $11.335,30 | $11.335,30 | 1.0 |
|
||

Wallitelli
WALLI
|
$0,00001129 | 0.0% | 25.2% | 47.4% | 97.5% | $580.383 | $11.291,22 | $11.291,22 | 1.0 |

|
|||
| 8847 |

SocialCrab
SCRB
|
$0,00001129 | 0.0% | 8.1% | 8.1% | 35.0% | $97,47 | $11.287,21 | $11.287,21 | 1.0 |

|
||

Strategic ETH Reserve
SΞR
|
$0,0001100 | 0.0% | 4.1% | 4.2% | 2.9% | $9,79 | $10.995,21 | $10.995,21 | 1.0 |

|
|||

Trio ICM
TRIO
|
$0,00001064 | 0.0% | 2.1% | 2.1% | 48.4% | $3,01 | $10.639,80 | $10.639,80 | 1.0 |

|
|||

AAAI_agent by Virtuals
AAAI
|
$0,00001004 | 0.0% | 1.9% | 9.0% | 14.5% | $0,9836 | $10.036,00 | $10.036,00 | 1.0 |

|
|||

Exodus AI
EXO
|
$0.059722 | 0.0% | 0.2% | 1.4% | 13.7% | $1,70 | $9.608,36 | $9.608,36 | 1.0 |

|
|||

PredicTools
PREDIC
|
$0.059425 | 0.0% | 2.9% | 6.6% | 20.0% | $15,86 | $9.420,90 | $9.420,90 | 1.0 |

|
|||

Dyordotcom
DYOR
|
$0,00001877 | 0.0% | 4.8% | 4.8% | 77.8% | $15,10 | $9.138,38 | $9.138,38 | 0.9999999999999998 |

|
|||

Liquidum
LIDUM
|
$0.059045 | 0.0% | 29.2% | 29.2% | 32.9% | $2,78 | $9.044,88 | $9.044,88 | 1.0 |

|
|||

Wisdomise AI
WSDM
|
$0,00001009 | 0.0% | 53.3% | 88.5% | 83.3% | $1.932,63 | $8.538,90 | $10.092,67 | 0.846049644444442 |

|
|||

VirtuBeauty by Virtuals
VBEA
|
$0.058443 | 0.0% | 2.6% | 10.1% | 0.9% | $1,64 | $8.442,96 | $8.442,96 | 1.0 |

|
|||

BelievePad
BPAD
|
$0.058355 | 0.0% | 1.9% | 7.2% | 5.3% | $3,92 | $8.332,20 | $8.332,20 | 1.0 |

|
|||

BOW
BOW
|
$0.058980 | 0.0% | 2.7% | 3.8% | 35.8% | $4,82 | $7.799,76 | $7.799,76 | 1.0 |

|
|||

We Will Huddle
HUDDLE
|
$0.057774 | 0.0% | 0.6% | 5.7% | 25.9% | $4,66 | $7.703,46 | $7.703,46 | 1.0 |

|
|||
| 9354 |

SWARM ENGINE
SWARM
|
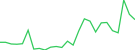
$0.057635 | 11.4% | 3.2% | 31.2% | 0.0% | $685,80 | $7.582,39 | $7.582,39 | 1.0 |
|
||
| 9443 |

Fable
FABLE
|
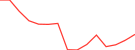
$0.057670 | 0.1% | 4.8% | 18.6% | 0.0% | $122,02 | $7.069,21 | $7.069,21 | 1.0 |
|
||
| 9505 |

Opus The Trencher
OPUS
|
$0.056922 | 0.0% | 0.4% | 7.0% | 23.5% | $2,26 | $6.723,99 | $6.723,99 | 1.0 |

|
||
| 9514 |

Sounder Liquidity
SOUNDER
|
$0.056675 | 0.1% | 7.3% | 15.6% | 93.6% | $198,40 | $6.674,55 | $6.674,55 | 1.0 |
|
||

REPO ANALYZER AI
REPOALYZE
|
$0.056713 | 0.0% | 7.3% | 7.3% | 14.6% | $24,95 | $6.644,71 | $6.710,78 | 0.9901548163052811 |

|
|||

Inferium
IFR
|
$0,00007615 | 0.0% | 4.8% | 11.5% | 7.1% | $4,23 | $6.576,19 | $19.036,88 | 0.3454448337994268 |

|
|||

QuantifyAI
QGG
|
$0.056552 | 0.0% | 3.9% | 0.8% | 19.3% | $1,63 | $6.541,31 | $6.541,31 | 1.0 |

|
|||
| 9572 |

Chain-Fox
CFX
|
Kopen
|
$0.056332 | 0.1% | 0.6% | 8.2% | 11.9% | $2,08 | $6.330,86 | $6.330,86 | 1.0 |

|
|

Kolytics
KOLT
|
$0,0007840 | 0.0% | 39.8% | 73.3% | 76.6% | $3.101,84 | $6.271,89 | $7.839,87 | 0.8 |

|
|||

toaster.trade
TOASTER
|
$0.056953 | 0.0% | 2.1% | 14.9% | 15.4% | $3,65 | $5.910,45 | $5.910,45 | 1.0 |

|
|||
| 9701 |

RobinSight
SIGHT
|
$0.055516 | 0.0% | 1.0% | 3.6% | 89.4% | $2,35 | $5.516,21 | $5.516,21 | 1.0 |
|
||
| 9874 |

Super Intelligent Identity
SIMD
|
$0.054673 | 0.0% | 1.8% | 28.9% | 0.0% | $7,74 | $4.672,55 | $4.672,55 | 1.0 |
|
||

Julia Swarm Syndicate
JSS
|
$0.054734 | 0.0% | 9.0% | 9.0% | 4.1% | $25,07 | $4.564,46 | $4.564,46 | 1.0 |

|
|||

0xsim by Virtuals
SAGE
|
$0.054512 | 0.0% | 5.6% | 8.2% | 5.8% | $1,44 | $4.512,35 | $4.512,35 | 1.0 |

|
|||
| 9924 |

MCAPS
MCAPS
|
$0.054451 | 0.1% | 1.7% | 98.2% | 0.0% | $693,06 | $4.450,61 | $4.450,61 | 1.0 |
|
||

RiceLabs
RICE
|
$0.054331 | 0.0% | 1.9% | 5.3% | 22.8% | $25,97 | $4.331,28 | $4.331,28 | 1.0 |

|
|||

ALINA AI
ALINAINTEL
|
$0.054322 | 0.0% | 3.7% | 3.7% | 26.4% | $1,32 | $4.309,92 | $4.309,92 | 1.0 |

|
|||

Degen Social Media
DEGEN
|
$0.054193 | 0.0% | 17.3% | 17.3% | 2.6% | $39,33 | $4.188,04 | $4.188,04 | 1.0 |

|
|||

FutureScanX
FSX
|
$0.054001 | 0.0% | 0.8% | 0.5% | 6.5% | $7,00 | $3.980,77 | $4.000,78 | 0.9949993937545369 |

|
|||

XScouter AI
XSAI
|
$0,007764 | 0.0% | 11.0% | 21.2% | 21.3% | $1,06 | $3.881,73 | $3.881,73 | 1.0 |

|
|||

SimiliScan
SMS
|
$0,00003844 | 0.0% | 3.0% | 5.3% | 22.5% | $8,64 | $3.844,49 | $3.844,49 | 1.0 |

|
|||

DexChart
CHART
|
$0.053766 | 0.0% | 3.8% | 7.4% | 26.4% | $1,97 | $3.765,65 | $3.765,65 | 1.0 |
|
|||
| 10131 |

AstheraFi
ASTHER
|
$0.053374 | 0.0% | 1.1% | 0.3% | 21.9% | $1,77 | $3.373,65 | $3.373,65 | 1.0 |

|
||

Grail
GRAIL
|
$0.053688 | 0.0% | 0.8% | 47.3% | 0.0% | $505,46 | $3.324,44 | $3.324,44 | 1.0 |
|
|||

Quanta
QNTA
|
$0.053286 | 0.0% | 0.4% | 2.1% | 0.0% | $2,64 | $3.220,21 | $3.220,21 | 1.0 |
|
|||

VoidScreener
VOID
|
$0.052895 | 0.0% | 13.7% | 13.7% | 15.5% | $6,90 | $2.876,09 | $2.876,09 | 1.0 |

|
|||

Lashi
LASHI
|
$0.052735 | 0.0% | 6.3% | 6.3% | 27.5% | $1,50 | $2.734,94 | $2.734,94 | 1.0 |

|
|||

Raindrop
RAIN
|
Kopen
|
$0.052571 | 0.0% | 1.8% | 12.4% | 12.0% | $47,74 | $2.570,94 | $2.570,94 | 1.0 |

|
||

BubbleLabs
BUBBLE
|
$0.052632 | 0.0% | 5.9% | 5.9% | 5.9% | $3,64 | $2.552,76 | $2.552,76 | 1.0 |

|
|||

Glint
$GLINT
|
$0.073346 | 0.0% | 30.1% | 46.3% | 0.0% | $401,86 | $2.342,52 | $3.346,46 | 0.7000000000000001 |

|
|||

Lens
LENS
|
$0.052364 | 0.0% | 2.1% | 15.7% | 81.8% | $7,21 | $2.320,59 | $2.363,28 | 0.981932825344961 |

|
|||

Alpha Lens X
ALPHAX
|
$0.052336 | 0.0% | 7.4% | 35.4% | 35.4% | $9,40 | $2.248,25 | $2.248,25 | 1.0 |

|
|||

sinex
SINX
|
$0.061167 | 0.0% | 7.1% | 7.6% | 41.9% | $39,32 | $2.014,76 | $2.014,76 | 1.0 |

|
|||

Pantheon
PNTH
|
$0.051962 | 0.0% | 4.0% | 22.1% | 28.4% | $10,96 | $1.961,79 | $1.961,79 | 1.0 |

|
|||

Attention Trade
ATTN
|
$0.067799 | 0.0% | 23.1% | 23.1% | 44.7% | $1,52 | $951,55 | $951,55 | 1.0 |

|
|||

Shitcoinscreener
SCREENER
|
$0.051719 | 0.0% | 58.0% | 58.0% | 58.0% | $152,81 | $648,77 | $1.719,38 | 0.3773250482452647 |

|
|||

Diverge Loop
DLC
|
$0.063018 | 0.0% | 99.5% | 99.5% | 99.7% | $1,81 | $268,56 | $301,76 | 0.89 |

|
|||

Trading Views
TRADINGVIEWS
|
$0,00 | - | - | - | - | - | - | - |

|
||||

AltsDaddy
DDY
|
$0,00 | - | - | - | - | - | - | - |

|
||||

DataPort Navigator by Virtuals
PORT
|
$0,00002822 | 0.0% | 1.1% | 8.9% | 34.2% | $21,67 | - | $28.222,24 |

|
||||

Sypool
SYP
|
$0,00007950 | 0.1% | 0.5% | 3.0% | 7.7% | $28,43 | - | $79.499,34 |

|
||||

Centcex
CENX
|
$0,00006971 | 0.1% | 0.8% | 0.5% | 5.1% | $38,82 | - | $696.829 |

|
||||

CyberHarbor
CHT
|
$0,00005579 | 0.0% | 0.4% | 0.0% | 50.7% | $70,98 | - | $55.791,03 |

|
||||

Ness Lab
NESS
|
$0,002326 | 0.5% | 3.4% | 1.3% | 1.9% | $79.740,91 | - | - |

|
||||

Dm.fun
FUN
|
$0,00 | - | - | - | - | - | - | - |

|
||||

Pullix
PLX
|
$0,0007038 | 0.0% | 0.6% | 5.5% | 20.9% | $8,53 | - | $140.759 |

|
||||

Bitcoin Silver AI
BSAI
|
$1.505,89 | 0.0% | 7.5% | 2.6% | 15.4% | $307.215 | - | $1.505.921.614.560 |

|
||||

XTTA
XTTA
|
$0,01023 | 1.0% | 2.2% | 18.8% | 23.5% | $1.852,02 | - | $3.280.414 |

|
||||

Token Metrics AI [OLD]
TMAI
|
$0.067925 | 0.0% | 3.3% | 0.8% | 9.2% | $11,25 | - | $7.893,65 |

|
||||

The Next Gem AI
GEMAI
|
$0,0002173 | 0.0% | 0.3% | 0.3% | 9.7% | $144,88 | - | $184.747 |

|
||||

AXiS ALiVE
AXIS
|
$294,12 | 2.0% | 0.9% | 13.3% | 25.4% | $149,45 | - | $294.129.951 |

|
||||

Reflecto
RTO
|
$0.097793 | 0.1% | 0.9% | 0.1% | 5.8% | $8,14 | - | $779.119 |

|
||||
101 tot 200 van 206 resultaten weergegeven
Rijen
Grafiek marktkapitalisatie top Analyse munten
De onderstaande grafiek toont de marktkapitalisatie en dominantie van de top Analyse, waaronder Pyth Network, The Graph, Genius en andere, over een specifieke periode.
Grafiek prestaties top Analyse munten
De onderstaande grafiek toont de relatieve prestaties van de top Analyse munten in de loop van de tijd, inclusief de procentuele winsten en verliezen in hun koers over verschillende periodes.


 Of bekijk hem in de app stores



