





Carteras
Añadir a la nueva cartera

Seguir
![]() vaya donde vaya
Reciba las novedades en tiempo real mediante notificaciones push en la aplicación.
Abrir aplicación
Las principales monedas Action Games según la capitalización de mercado
La capitalización de mercado de Action Games hoy es de 31,5 millones $, lo que supone un cambio del -3.1% en las últimas 24 horas.
Lo más destacado
$31.468.592
Cap. mercado
3.1%

$7.880.143
Volumen en 24 horas

🔥 En tendencia
Las monedas en tendencia no están disponibles en este momento.
| # | Moneda | Precio | 1 h | 24 h | 7 d | 30 d | Volumen en 24 h | Cap. de mercado | FDV | Cap. de mercado/FDV | Últimos 7 días | ||
|---|---|---|---|---|---|---|---|---|---|---|---|---|---|
| 1254 |

Gods Unchained
GODS
|
$0,01883 | 0.0% | 2.2% | 6.4% | 13.8% | $23.757,82 | $8.514.266 | $9.413.807 | 0.904444428804 |
|
||
| 1442 |

Gunz
GUN
|
$0,001551 | 4.2% | 8.9% | 13.0% | 36.7% | $5.499.758 | $6.280.116 | $15.513.241 | 0.40482295079999997 |
|
||
| 1542 |

Heroes of Mavia
MAVIA
|
$0,02118 | 3.6% | 11.2% | 18.0% | 23.9% | $738.413 | $5.292.929 | $5.292.929 | 1.0 |
|
||
| 1818 |

Wilder World
WILD
|
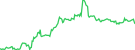
$0,007014 | 4.2% | 8.7% | 14.3% | 44.5% | $96.859,53 | $3.503.794 | $3.503.794 | 1.0 |
|
||
| 2903 |

Katana Inu
KATA
|
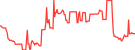
$0,00002558 | 3.2% | 9.2% | 22.3% | 33.6% | $24.147,27 | $1.008.966 | $1.279.030 | 0.7888526614595358 |
|
||
| 2999 |

QORPO WORLD
QORPO
|
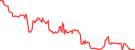
$0,001374 | 1.6% | 8.5% | 35.3% | 43.9% | $57.606,50 | $894.481 | $1.030.661 | 0.8678714743862668 |
|
||
| 3143 |

Bomb Crypto (BNB)
BCOIN
|
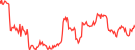
$0,007896 | 3.8% | 5.1% | 10.4% | 26.7% | $6.555,99 | $784.645 | $784.645 | 0.9999999924221994 |
|
||
| 3294 |

Guild of Guardians
GOG
|
$0,0007498 | 0.7% | 5.1% | 9.6% | 26.4% | $1.505,17 | $668.683 | $749.812 | 0.8918006722990001 |
|
||
| 3303 |

Seraph
SERAPH
|
$0,002085 | 0.0% | 0.2% | 1.7% | 1.2% | $173,10 | $664.096 | $2.084.807 | 0.318540892 |
|
||
| 3354 |

SIPHER
SIPHER
|
$0,001545 | 4.9% | 9.2% | 23.0% | 54.8% | $1,69 | $632.080 | $633.982 | 0.9969991732827407 |
|
||
| 3528 |

MagicCraft
MCRT
|
$0,0001070 | 1.3% | 0.4% | 10.6% | 22.3% | $80.784,28 | $539.912 | $771.567 | 0.6997605433192117 |
|
||
| 3532 |

ISLAND Token
ISLAND
|
$0,003179 | 0.0% | 9.4% | 15.8% | 12.7% | $9.676,35 | $535.004 | $2.931.591 | 0.18249599557774285 |
|
||
| 3752 |

MemeFi
MEMEFI
|
$0,00004420 | 0.0% | 30.1% | 2.4% | 32.2% | $1,21 | $441.974 | $441.974 | 1.0 |
|
||
| 3908 |

Vulcan Forged
PYR
|
$0,01265 | 2.1% | 12.4% | 16.8% | 36.5% | $178.656 | $388.301 | $632.440 | 0.6139718897840459 |
|
||
| 4137 |

XAYA
WCHI
|
$0,005542 | 5.2% | 10.5% | 24.5% | 27.5% | $4.523,43 | $323.299 | $429.238 | 0.753192301395484 |
|
||
| 4724 |

WAGMI Games
WAGMIGAMES
|
$0.061012 | 4.9% | 6.0% | 18.7% | 43.7% | $46,84 | $206.127 | $222.508 | 0.9263799802452389 |
|
||
| 4862 |

STEPN Green Satoshi Token on BSC
GST-BSC
|
$0,0008502 | 2.1% | 3.1% | 5.7% | 30.5% | $304,55 | $184.866 | $184.866 | 1.0 |
|
||
| 4981 |

Genopets
GENE
|
$0,001701 | 2.8% | 1.0% | 18.6% | 24.6% | $437,68 | $170.008 | $170.204 | 0.9988452004999999 |
|
||
| 5203 |

Sinverse
SIN
|
$0,0001590 | 3.2% | 1.4% | 28.9% | 12.8% | $5.517,43 | $148.773 | $158.954 | 0.93595029213 |
|
||
| 5217 |

Nyan Heroes
NYAN
|
$0,0003630 | 1.3% | 7.2% | 14.8% | 23.3% | $1.362,02 | $147.256 | $363.012 | 0.4056501089167958 |
|
||
| 5787 |

Bombie
BOMB
|
$0,00001167 | 0.0% | 0.7% | 0.2% | 5.9% | $2,33 | $105.044 | $116.716 | 0.9 |
|
||
| 5914 |

Champignons of Arborethia
CHAMPZ
|
$0,00009782 | 5.3% | 6.0% | 18.9% | 31.7% | $15,39 | $97.815,40 | $97.815,40 | 1.0 |
|
||
| 5961 |

Materium
MTRM
|
$0,005037 | 0.0% | 11.7% | 11.7% | 34.0% | $16,66 | $94.963,38 | $94.963,38 | 1.0 |

|
||
| 6066 |

Decimated
DIO
|
$0,0001628 | 0.8% | 12.1% | 14.1% | 40.7% | $2.854,11 | $88.373,87 | $162.673 | 0.5432598482400001 |
|
||
| 6211 |

StarHeroes
STAR
|
$0,0003539 | 4.1% | 7.7% | 16.7% | 37.1% | $3,45 | $81.201,93 | $207.370 | 0.39157935688309375 |
|
||
| 6232 |

REVV
REVV
|
$0,00007222 | 3.2% | 5.4% | 13.6% | 21.8% | $736,30 | $80.214,96 | $216.753 | 0.37007581266666667 |
|
||
| 6257 |

MoonPrime Games
LUNAR
|
$0,00008883 | 0.0% | 0.7% | 3.5% | 13.9% | $1,06 | $79.543,80 | $79.543,80 | 1.0 |
|
||
| 6295 |

Revomon
REVO
|
$0,002735 | 0.0% | 3.0% | 3.0% | 71.7% | $28,37 | $77.905,56 | $125.804 | 0.6192596627943577 |
|
||
| 6762 |

Cryowar
CWAR
|
$0,0001994 | 4.7% | 1.9% | 0.5% | 52.5% | $3.337,50 | $60.039,04 | $199.349 | 0.3011761683017524 |
|
||
| 7538 |

Apeiron
APRS
|
$0,0001658 | 0.0% | 2.4% | 16.8% | 53.4% | $5,78 | $40.555,23 | $165.817 | 0.2445782726343477 |
|
||
| 7616 |

Pirate Nation Token
PIRATE
|
$0,00005451 | 0.0% | 0.6% | 23.2% | 76.4% | $1,45 | $39.141,13 | $53.376,96 | 0.7332962832705991 |
|
||
| 7710 |

MetaDOS
SECOND
|
$0.053808 | 1.2% | 2.2% | 1.1% | 2.6% | $93,78 | $37.581,67 | $38.074,53 | 0.9870553682369585 |
|
||
| 7974 |

Niftyx Protocol
SHROOM
|
$0,0007748 | 0.0% | 6.4% | 60.5% | 63.6% | $68,61 | $33.374,39 | $50.793,88 | 0.6570552983531595 |
|
||
| 8901 |

Hive Game Token
HGT
|
$0.057285 | 0.8% | 0.0% | 2.1% | 3.8% | $172,52 | $22.606,27 | $36.255,17 | 0.6235322831140765 |
|
||
| 8912 |

Striker League
MBS
|
$0,00002251 | 0.0% | 1.0% | 1.3% | 17.0% | $1,70 | $22.513,39 | $22.511,91 | 1.0000659649142378 |
|
||
| 9037 |

Shockwaves
NEUROS
|
$0,0003461 | 0.0% | 15.3% | 18.0% | 23.3% | $6,28 | $21.262,28 | $34.613,59 | 0.6142754874747812 |
|
||
| 9544 |

Light Speed Cat
LSCAT
|
$0,0002201 | 0.0% | 7.5% | 15.9% | 20.5% | $5,35 | $17.398,07 | $17.398,07 | 1.0 |
|
||
| 9554 |

Dark Frontiers
DARK
|
$0,00008052 | 0.0% | 0.6% | 0.6% | 1.0% | $4,95 | $17.326,47 | $20.124,63 | 0.8609582318528486 |
|
||
| 9747 |

Engines of Fury
FURY
|
$0,0001821 | 0.0% | 0.2% | 1.5% | 4.1% | $1,59 | $16.021,15 | $21.674,29 | 0.7391775170104953 |
|
||
| 9779 |

PanoVerse
PANO
|
$0,0005651 | 0.0% | 17.2% | 17.2% | 26.0% | $6,48 | $15.823,43 | $15.823,43 | 1.0 |
|
||
| 10380 |

Xociety
XO
|
$0,00002329 | 0.0% | 14.3% | 14.3% | 14.3% | $128,12 | $12.342,61 | $116.440 | 0.106 |
|
||
| 10434 |

Relic
RELIC
|
$0,00001219 | 4.8% | 11.2% | 5.6% | 58.2% | $77,52 | $12.164,15 | $12.164,15 | 1.0 |
|
||
| 10466 |

SENATE
SENATE
|
$0,00008135 | 0.0% | 3.6% | 10.9% | 28.2% | $45,62 | $11.955,98 | $13.282,42 | 0.9001356027300997 |
|
||
| 10677 |

MetaFighter
MF
|
$0.058998 | 0.0% | 11.5% | 26.7% | 30.4% | $17,18 | $11.072,59 | $11.247,96 | 0.9844085477229361 |
|
||
| 10682 |

Utgard
UTG
|
$0,00003074 | 0.0% | 0.2% | 0.2% | 0.9% | $3,71 | $11.066,02 | $18.444,14 | 0.5999746358587331 |

|
||
| 10856 |

AndreyWTR
WTR
|
$0,00001099 | 0.0% | 7.9% | 15.1% | 41.8% | $15,02 | $10.426,08 | $10.426,08 | 1.0 |
|
||
| 11778 |

Artyfact
ARTY
|
$0,0002996 | 0.0% | 90.0% | 90.0% | 96.9% | $0,03510 | $7.426,84 | $7.426,84 | 0.9999999815405409 |
|
||
| 12223 |

Battle.tech by Virtuals
BTA
|
$0.059086 | 0.0% | 25.2% | 25.2% | 32.6% | $296,66 | $6.360,43 | $9.086,33 | 0.7000000000000001 |

|
||
| 12809 |

Undead Blocks
UNDEAD
|
$0,0003465 | 4.9% | 1.9% | 5.2% | 22.1% | $199,50 | $5.196,17 | $173.206 | 0.030000000000000002 |
|
||
| 14262 |

LEAGUE OF TRENCHES
LOT
|
$0.054412 | 0.0% | 9.7% | 9.4% | 3.1% | $4,01 | $3.086,19 | $4.409,86 | 0.6998394970186129 |
|
||
| 15308 |

Gameswap
GSWAP
|
$0,0001662 | 0.0% | 98.6% | 98.7% | 99.0% | $5.247,25 | $1.833,87 | $3.324,39 | 0.5516419047331803 |
|
||

Cantina Royale
CRT
|
$0,00004825 | 3.7% | 8.9% | 16.4% | 29.5% | $0,002760 | - | $6.384,24 |
|
||||

Arker
ARKER
|
$0.057343 | 0.0% | 4.5% | 4.5% | 4.5% | $1,02 | - | $14.685,98 |
|
||||

Thetan World
THG
|
$0,0001053 | 0.0% | 4.6% | 6.5% | 19.2% | $5,83 | - | $44.205,91 |
|
||||

DeFi Kingdoms
JEWEL
|
$0,004436 | 2.7% | 8.9% | 7.7% | 15.5% | $249,59 | - | $529.778 |
|
||||

Mines of Dalarnia
DAR
|
$0,02689 | 3.7% | 5.8% | 15.1% | 20.5% | $15,61 | - | $21.513.525 |
|
||||

Chronyx Studios
CHX
|
$0,00 | - | - | - | - | - | - | - |

|
||||

Genesis Core Token
GCORE
|
$0,00 | - | - | - | - | - | - | - |

|
||||
Mostrando resultados 1 a 58 de un total de 58
Filas
Gráfico de cap. de mercado de las principales monedas Action Games
El siguiente gráfico muestra la capitalización de mercado y el dominio de las principales Action Games, entre ellas Gods Unchained, Gunz, Heroes of Mavia, etc. durante un periodo de tiempo.
Gráfico de rendimiento de las principales monedas Action Games
El siguiente gráfico muestra el rendimiento relativo de las principales monedas Action Games a lo largo del tiempo. Para ello, tiene en cuenta sus ganancias y pérdidas porcentuales en términos de precio en diferentes periodos.




 O búsquela en las tiendas de aplicaciones



