





Portefeuilles
Ajouter à un nouveau portefeuille

Suivre
![]() en déplacement
Recevez des mises à jour en temps réel via des notifications Push sur l'application.

Ouvrir l'application
Top Plateforme de contrats intelligents des monnaies par capitalisation boursière
La capitalisation boursière de Plateforme de contrats intelligents aujourd'hui est de 1,69 billion $, soit une variation de -4.8% au cours des dernières 24 heures.
Principaux éléments
$1 695 673 691 432
Capitalisation boursière
4.7%

$89 906 405 717
Volume sur 24 h


| # | Monnaie | Cours | 1 h | 24 h | 7 j | 30 j | Volume sur 24 h | Capitalisation boursière | FDV | Capitalisation boursière / FDV | 7 derniers jours | ||
|---|---|---|---|---|---|---|---|---|---|---|---|---|---|
| 14567 |

Datagram Network
DGRAM
|
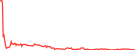
$0.057135 | 0.0% | 35.0% | 42.7% | 56.2% | $1 353,95 | $1 775,08 | $71 345,55 | 0.02488 |
|
||
| 14700 |

Stohn Coin
SOH
|
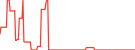
$0,001219 | 0.0% | 19.6% | 1.7% | 69.3% | $24,48 | $1 385,07 | $1 385,07 | 1.0 |
|
||
| 14787 |

Multiple Network
MTP
|
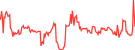
$0,00002033 | 0.0% | 14.9% | 11.7% | 87.2% | $42,99 | $914,96 | $20 332,44 | 0.045000000000000005 |
|
||
| 15008 |

AXION
AXION
|
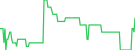
$0.069987 | 0.0% | 50.0% | 98.8% | 90.0% | $139,81 | $249,68 | $998,74 | 0.25 |
|
||
| 15257 |

IRISnet
IRIS
|
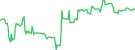
$0.089179 | 0.0% | 2.1% | 35.9% | 23.6% | $0,1610 | $13,23 | $19,73 | 0.6706850023677688 |
|
||

Aergo [OLD]
AERGO
|
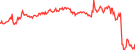
$0,01278 | 0.8% | 7.4% | 17.5% | 31.4% | $28 543,59 | - | $6 388 261 |
|
||||

Secret (ERC20)
WSCRT
|
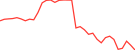
$0,009691 | 0.2% | 6.9% | 24.6% | 30.2% | $119,40 | - | $11 303,35 |
|
||||

Fantom
FTM
|
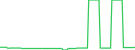
$0,02544 | 0.0% | 21.1% | 23.9% | 54.0% | $5,57 | - | $80 762 081 |
|
||||

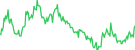
EOS
EOS
|
$0,06510 | 1.9% | 4.3% | 9.9% | 35.1% | $7 318,17 | - | $136 708 664 |
|
||||

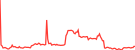
PERL.eco
PERL
|
$0,00009590 | 0.2% | 6.5% | 17.6% | 31.9% | $36,15 | - | $66 472,83 |
|
||||

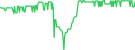
Naka Bodhi
NBOT
|
$0,006990 | 0.0% | 0.1% | 0.1% | 0.3% | $108,27 | - | $698 985 |
|
||||

MATIC (migrated to POL)
MATIC
|
$0,1262 | - | - | - | - | $0,1468 | - | $1 261 558 705 |

|
||||

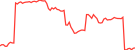
Coreum [OLD]
COREUM
|
$0,006965 | 0.0% | 4.0% | 4.0% | 27.0% | $47,14 | - | $4 525 043 |
|
||||

Ink
INK
|
$0,00 | - | - | - | - | - | - | - |

|
||||

Fruits
FRTS
|
$0.053723 | 0.1% | 0.0% | 0.3% | 16.0% | $84 613,07 | - | $148 925 |
|
||||

c8ntinuum
CTM
|
Acheter
|
$0,1970 | 0.5% | 1.2% | 1.4% | 9.8% | $2 938 582 | - | $1 750 709 822 |
|
|||

Lightchain AI
LCAI
|
$0,0007391 | 0.2% | 5.1% | 21.8% | 22.5% | $16 054,75 | - | $7 391 183 |
|
||||

SAFE(AnWang)
SAFE
|
$1,46 | 0.0% | 1.8% | 13.4% | 24.5% | $19 239,29 | - | $3 705 066 |
|
||||

Turingbitchain
TBC
|
$3,42 | 0.3% | 1.1% | 9.9% | 29.1% | $359 119 | - | $514 245 523 |
|
||||

MEVerse
MEV
|
$0,002410 | 0.3% | 0.9% | 2.3% | 17.2% | $308 461 | - | $4 820 680 |
|
||||

Rubix
RBT
|
$1,49 | 0.0% | 19.5% | 89.3% | 94.1% | $859,61 | - | $9 200 142 |
|
||||

Asset
ASSET
|
$0,00 | - | - | - | - | - | - | - |

|
||||

Darwinia Network xRING
XRING
|
$0,00 | - | - | - | - | - | - | - |

|
||||

Berachain Governance Token
BGT
|
$0,00 | - | - | - | - | - | - | - |

|
||||

Bitcorn
BTCN
|
$0,00 | - | - | - | - | - | - | - |

|
||||

Layer One X
L1X
|
$6,99 | 1.5% | 1.7% | 1.7% | 15.7% | $34 467,32 | - | $4 102 525 423 |
|
||||

Quantum Fusion
QF
|
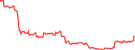
$0,02208 | 0.2% | 13.9% | 31.0% | 50.6% | $1 933,25 | - | $220 750 |
|
||||

MANA3
MANA3
|
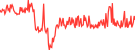
$0,003633 | 1.9% | 2.9% | 1.1% | 32.4% | $17 157,57 | - | $1 816 513 |
|
||||

Zedxion
ZEDX
|
$0,00 | - | - | - | - | - | - | - |

|
||||

Maal Chain
MAAL
|
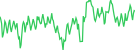
$0,1776 | 0.5% | 0.7% | 2.0% | 7.1% | $1 120 954 | - | $1 776 021 570 |
|
||||

Paladeum
PLB
|
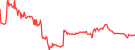
$0,1707 | 0.0% | 0.9% | 6.2% | 5.0% | $3,93 | - | $170 747 108 |
|
||||

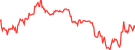
SMART BLOCKCHAIN
SMART
|
$0,003704 | 0.0% | 1.0% | 3.1% | 14.1% | $187 742 | - | $33 338 262 893 |
|
||||

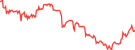
Japan Open Chain
JOC
|
$0,01264 | 0.0% | 0.1% | 35.2% | 54.1% | $362,32 | - | $12 641 647 |
|
||||

GRAIN
GRAIN
|
$0,00 | - | - | - | - | - | - | - |

|
||||

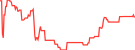
Klever Finance
KFI
|
$0,1900 | 0.1% | 0.1% | 15.8% | 35.7% | $52,12 | - | $3 989 606 |
|
||||

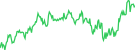
Bitcoin Vault
BTCV
|
$0,3196 | 0.7% | 3.1% | 10.9% | 28.6% | $90 957,15 | - | $6 710 566 |
|
||||

Marscoin
MARS
|
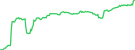
$0,06001 | 0.2% | 0.4% | 1.4% | 16.1% | $11 971,97 | - | $2 400 475 |
|
||||

Polis
POLIS
|
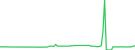
$0,0001434 | 0.3% | 0.9% | 2.2% | 8.6% | $2,05 | - | $2 431,58 |
|
||||

Primecoin
XPM
|
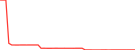
$0,01798 | 0.0% | 0.0% | 5.3% | 47.1% | $5,85 | - | $902 860 |
|
||||

Bitcoin Atom
BCA
|
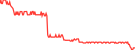
$0,04615 | 3.5% | 29.1% | 36.4% | 21.9% | $45,10 | - | $969 066 |
|
||||

Bytecoin
BCN
|
$0,00002987 | 0.0% | 0.0% | 6.8% | 8.1% | $0,01494 | - | $5 498 168 |

|
||||

MimbleWimbleCoin
MWC
|
Acheter
|
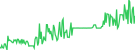
$7,04 | 0.2% | 27.8% | 5.6% | 45.1% | $21 660,38 | - | $77 597 593 |
|
|||

Lemon
LEMX
|
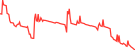
$3,91 | 0.0% | 2.2% | 11.8% | 36.1% | $4 374,86 | - | $195 284 020 |
|
||||

EIOB
EIOB
|
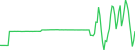
$4,84 | 0.0% | 2.0% | 0.1% | 2.9% | $43 486,36 | - | $48 369 776 695 |
|
||||

Doric Network
DRC
|
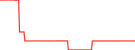
$0,06850 | 0.0% | 0.1% | 0.2% | 37.6% | $22 156,13 | - | $41 100 330 |
|
||||

PHPCoin
PHP
|
$0,00 | - | - | - | - | - | - | - |

|
||||

NuCypher
NU
|
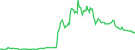
$0,01167 | 1.0% | 5.8% | 17.8% | 27.6% | $157,35 | - | $45 332 578 |
|
||||

NoLimitCoin
NLC
|
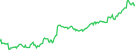
$0,0003048 | 0.1% | 4.8% | 6.8% | 17.3% | $1 153,82 | - | $273 294 |
|
||||

Alias
ALIAS
|
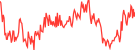
$0,03962 | 0.1% | 5.5% | 17.3% | 32.2% | $51,82 | - | $792 342 |
|
||||

Freedomcoin
FREED
|
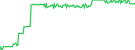
$0,001421 | 0.3% | 5.2% | 6.2% | 12.6% | $2 506,58 | - | $25 571,48 |
|
||||

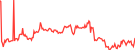
Klaytn
KLAY
|
$0,02806 | 0.1% | 4.1% | 9.7% | 33.5% | $31 188,91 | - | $181 581 356 |
|
||||

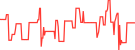
ULTRON
ULX
|
$0,00001397 | 0.0% | 3.5% | 13.6% | 33.0% | $8,68 | - | $66 872,72 |
|
||||

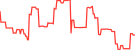
Aura Network [OLD]
AURA
|
$0,007122 | 0.3% | 1.1% | 0.3% | 17.9% | $2,26 | - | $2 942 627 |
|
||||

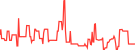
Tenup
TUP
|
$0,002476 | 0.0% | 8.2% | 1.3% | 35.3% | $533,32 | - | $141 155 |
|
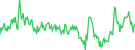
||||

Football Coin
XFC
|
$0,006282 | 0.1% | 0.1% | 0.5% | 6.6% | $55 878,28 | - | $6 281 730 |
|
||||

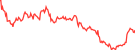
Whitecoin
XWC
|
$0,001866 | 0.4% | 22.2% | 46.4% | 82.1% | $622 403 | - | $1 678 164 |
|
||||

ABBC
ABBC
|
$0,002997 | 0.0% | 0.3% | 5.4% | 17.0% | $90,85 | - | - |
|
||||

Fraxtal
FXTL
|
$0,00 | - | - | - | - | - | - | - |

|
||||

zkCross Network
CROSSAI
|
$0,00 | - | - | - | - | - | - | - |

|
||||

DOS Chain
DOS
|
$0,00 | - | - | - | - | - | - | - |

|
||||

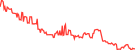
Giant Mammoth
GMMT
|
$0,001017 | 0.3% | 4.5% | 7.9% | 25.5% | $1 978,23 | - | - |
|
||||

DeFi Kingdoms
JEWEL
|
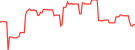
$0,004566 | 0.0% | 1.0% | 6.2% | 12.7% | $95,12 | - | $545 279 |
|
||||

WPAY
WPAY
|
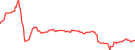
$1,07 | 0.3% | 2.5% | 2.1% | 21.1% | $2 852 667 | - | $10 695 272 589 |
|
||||

Blast
BLAST
|
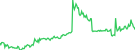
$0.067889 | 0.0% | 5.3% | 11.3% | 99.1% | $21,66 | - | $78 885,47 |
|
||||

LayerK
LYK
|
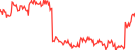
$0,05871 | 0.2% | 0.3% | 0.6% | 9.9% | $361 298 | - | $58 714 758 |
|
||||

Laïka
LAIKA
|
$0,02084 | 0.0% | 7.2% | 22.2% | 40.8% | $16 229,46 | - | $2 083 974 |
|
||||

Glue
GLUE
|
$0,00 | - | - | - | - | - | - | - |

|
||||

Vanar Chain [OLD]
VANRY
|
$0,0003361 | 0.0% | 22.4% | 21.9% | 53.9% | $24,21 | - | $799 044 |
|
||||

PulseChain
PLS
|
$0.054693 | 0.0% | 3.4% | 7.2% | 43.6% | $140,36 | - | $633 983 226 |
|
||||

XOC
XOC
|
$0,00 | - | - | - | - | - | - | - |

|
||||

Botchain
METAKPK
|
$1,31 | 0.1% | 0.5% | 0.7% | 0.4% | $106 784 | - | - |
|
||||

Huddle01
HUDL
|
$0,00 | - | - | - | - | - | - | - |

|
||||

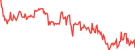
Galactica.com
GNET
|
$0,001748 | 1.9% | 2.1% | 8.7% | 49.5% | $639,35 | - | $1 748 037 |
|
||||

Rise Chain
RISE
|
$0,00 | - | - | - | - | - | - | - |

|
||||

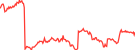
Gitopia
LORE
|
$0,0001914 | 0.3% | 2.3% | 18.2% | 60.8% | $4,72 | - | $95 686,81 |
|
||||

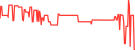
Atlantis Coin
ATC
|
$3 191,62 | 0.0% | 5.7% | 7.7% | 13.4% | $2 667 453 | - | $319 162 428 042 |
|
||||

ZugChain
ZUG
|
$0,00 | - | - | - | - | - | - | - |

|
||||

Solarious
SOLAR
|
$0,00 | - | - | - | - | - | - | - |

|
||||

Lumera
LUME
|
$0,00 | - | - | - | - | - | - | - |

|
||||

BOT
BOT
|
$12,67 | 0.1% | 0.1% | 0.8% | 2.5% | $172 620 | - | $1 900 740 502 |
|
||||

Acki Nacki
NACKL
|
$0,00 | - | - | - | - | - | - | - |

|
||||

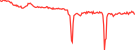
Capx AI [OLD]
CAPX
|
$0,1330 | 0.0% | 11.5% | 11.7% | 11.7% | $46 925,58 | - | $132 997 192 |
|
||||

Base
BASE
|
$0,00 | - | - | - | - | - | - | - |

|
||||

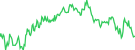
BounceBit
BB
|
$0,005016 | 0.9% | 7.6% | 16.6% | 43.3% | $947 324 | - | $10 533 089 |
|
||||

Endless
EDS
|
$0,00 | - | - | - | - | - | - | - |

|
||||

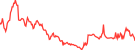
Riaspace
RIA
|
$0,6475 | 0.3% | 4.3% | 8.9% | 17.2% | $1 573 062 | - | $174 383 |
|
||||

Swisstronik
SWTR
|
$0,00 | - | - | - | - | - | - | - |

|
||||

Gopher
GOAI
|
$0,00 | - | - | - | - | - | - | - |

|
||||

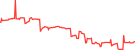
XEN Crypto (BSC)
BXEN
|
$0.0104926 | 0.2% | 1.1% | 5.4% | 7.5% | $36,60 | - | $25 143,28 |
|
||||

Symbol
XYM
|
$0,002284 | 0.3% | 6.8% | 4.2% | 16.8% | $25 013,60 | - | $20 553 386 |
|
||||

Zetrix
ZETRIX
|
$1,60 | 0.2% | 6.3% | 13.6% | 51.3% | $6 543,38 | - | $2 213 289 764 |
|
||||

Bespincoin
BSP
|
$0,00 | - | - | - | - | - | - | - |

|
||||

Xahau
XAH
|
$0,01163 | 0.1% | 10.3% | 9.5% | 10.7% | $1 714,70 | - | $3 242 205 |
|
||||

Yellow
YELLOW
|
$0,08111 | 0.5% | 5.1% | 14.4% | 10.5% | $3 091 256 | - | $811 127 265 |
|
||||

Graphite Network
@G
|
$0,007455 | 5.7% | 5.7% | 7.8% | 8.5% | $60,99 | - | $78 281,16 |
|
||||

GlobalChainZ
GCZ
|
$0,04242 | 2.9% | 8.7% | 26.8% | 30.9% | $61 630,81 | - | - |
|
||||

Real Ether
REETH
|
$0,00 | - | - | - | - | - | - | - |

|
||||

Nebula Cash
NEBX
|
$0,00 | - | - | - | - | - | - | - |

|
||||

Haust
HAUST
|
$0,01088 | 0.0% | 0.6% | 0.6% | 0.0% | $1,69 | - | $108 764 876 |

|
||||

EGAS
EGAS
|
$0,00 | - | - | - | - | - | - | - |

|
||||
Afficher les résultats de 701 à 800 sur 861
Lignes
Plateforme de contrats intelligents Catégories
| Nom | 24 h | Capitalisation boursière |
|---|---|---|
|
Tous Plateforme de contrats intelligents
|
4.8%
|
$1 694 415 230 156
|
|
Couche 1 (L1)
|
4.8%
|
|
|
Proof Of Work Pow
|
4.5%
|
|
|
Proof Of Stake Pos
|
5.9%
|
|
|
Zero Knowledge (ZK)
|
12.7%
|
|
|
Couche 2 (L2)
|
4.6%
|
|
|
Privacy Blockchain
|
4.5%
|
|
|
Layer 0 L0
|
5.2%
|
|
|
Superchain Ecosystem
|
6.0%
|
|
|
Sidechain
|
5.6%
|
|
|
Gaming Blockchains
|
4.3%
|
|
Graphique de la capitalisation boursière des principaux secteurs Plateforme de contrats intelligents
Le graphique ci-dessous présente la capitalisation boursière et la prédominance au sein des Plateforme de contrats intelligents sous-catégories notamment Couche 1 (L1), Proof Of Work Pow, et bien d'autres sur une période donnée.
Graphique des performances des principaux Plateforme de contrats intelligents secteurs
Le graphique ci-dessous présente la performance relative des sous-catégories Plateforme de contrats intelligents au fil du temps, en suivant leurs gains et pertes en termes de pourcentage de capitalisation boursière sur différentes périodes.
Dernières actualités de Plateforme de contrats intelligents






 Ou consultez l'application dans les magasins d'applications



