





Portefeuilles
Ajouter à un nouveau portefeuille

Suivre
![]() en déplacement
Recevez des mises à jour en temps réel via des notifications Push sur l'application.
Ouvrir l'application
Top Plateforme de contrats intelligents des monnaies par capitalisation boursière
La capitalisation boursière de Plateforme de contrats intelligents aujourd'hui est de 1,7 billion $, soit une variation de -4.7% au cours des dernières 24 heures.
Principaux éléments
$1 696 460 079 210
Capitalisation boursière
4.7%

$90 152 522 323
Volume sur 24 h


| # | Monnaie | Cours | 1 h | 24 h | 7 j | 30 j | Volume sur 24 h | Capitalisation boursière | FDV | Capitalisation boursière / FDV | 7 derniers jours | ||
|---|---|---|---|---|---|---|---|---|---|---|---|---|---|

Cedra Network
$CED
|
$0,00 | - | - | - | - | - | - | - |

|
||||

CoNET Network
CONET
|
$0,00 | - | - | - | - | - | - | - |

|
||||

Unit Network
UNIT
|
$0,00 | - | - | - | - | - | - | - |

|
||||

Quranium
QRN
|
$0,00 | - | - | - | - | - | - | - |

|
||||

ZkCloud
PROOF
|
$0,00 | - | - | - | - | - | - | - |

|
||||

BlockX
BCX
|
$0,00 | - | - | - | - | - | - | - |

|
||||

UraniumX
URX
|
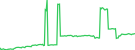
$0,5864 | 0.0% | 0.8% | 12.7% | 27.5% | $0,1231 | - | $137 799 |
|
||||

Newton
NTN
|
$0,00 | - | - | - | - | - | - | - |

|
||||

HeliChain
HELI
|
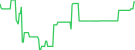
$0.054196 | 0.0% | 0.0% | 18.2% | 15.8% | $0,7478 | - | - |
|
||||

Qitcoin
QTC
|
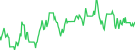
$0,0003813 | 0.0% | 24.5% | 38.2% | 68.2% | $457,28 | - | $40 036,29 |
|
||||

Nengcoin
NENG
|
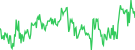
$0.064603 | 0.4% | 10.1% | 1.1% | 17.8% | $117,74 | - | - |
|
||||

Locus Chain
LOCUS
|
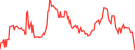
$0,003394 | 0.2% | 3.3% | 27.1% | 36.5% | $65 511,36 | - | $23 756 171 |
|
||||

Siriusnet
SINT
|
$0,00 | - | - | - | - | - | - | - |

|
||||

Snowman
SNOW
|
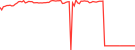
$0.0106368 | 0.0% | 22.6% | 2.2% | 8.0% | $229,73 | - | $56 601,22 |
|
||||

Cubechain
QUB
|
$0,00 | - | - | - | - | - | - | - |

|
||||

ZHC : Zero Hour Cash
ZHC
|
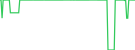
$0,001328 | 0.0% | 0.0% | 0.0% | 13.4% | $0,02108 | - | $398 378 |
|
||||

Auton
ATN
|
$0,00 | - | - | - | - | - | - | - |

|
||||

Tangle Network
TNT
|
$0,00 | - | - | - | - | - | - | - |

|
||||

Meta Finance Elements Verse
MFEV
|
$0,00 | - | - | - | - | - | - | - |

|
||||

Sardis Network
SRDS
|
$0,005024 | 0.0% | 4.6% | 0.2% | 16.8% | $155,03 | - | $1 578 430 |
|
||||

wanXRP
WANXRP
|
$0,7352 | 0.4% | 4.2% | 26.5% | 47.4% | $246,09 | - | $511 410 |
|
||||

STO Chain
STOC
|
$0,8768 | 0.0% | 0.1% | 0.3% | 1.7% | $150 998 | - | - |
|
||||

Americoin
AMC
|
$0,00 | - | - | - | - | - | - | - |

|
||||

Safrochain SAF token
SAF
|
$0,00 | - | - | - | - | - | - | - |

|
||||

Oxin
OXIN
|
$0,00 | - | - | - | - | - | - | - |

|
||||

GGEZ1
GGEZ1
|
$0,08839 | 0.3% | 1.1% | 0.6% | 0.5% | $64 439,91 | - | $157 131 261 |
|
||||

BTCMobick
BMB
|
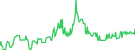
$74,32 | 0.7% | 10.1% | 19.8% | 36.2% | $46 046,97 | - | $2 832 611 144 |
|
||||

HarvestAI
BTH
|
$0,00 | - | - | - | - | - | - | - |

|
||||

Vecno
VE
|
$0,00 | 0.0% | 0.0% | 0.0% | 0.0% | - | - | - |

|
||||

Panjea
PANJ
|
$0,00 | - | - | - | - | - | - | - |

|
||||

TEXITcoin
TXC
|
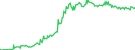
$0,08469 | 0.1% | 1.3% | 11.9% | 23.7% | $462,20 | - | $8 300 313 |
|
||||

Mixin
XIN
|
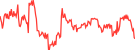
$38,11 | 0.2% | 4.1% | 11.4% | 26.5% | $28 085,10 | - | $38 108 817 |
|
||||

xBear Network
XBEAR
|
$0,00 | - | - | - | - | - | - | - |

|
||||

Meta Earth
MEC
|
$0,00 | - | - | - | - | - | - | - |

|
||||

SymVerse
SYMM
|
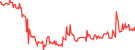
$0,02110 | 0.0% | 27.2% | 38.9% | 52.0% | $1 110,80 | - | $5 514 092 |
|
||||

GOSH
GOSH
|
$0,00 | - | - | - | - | - | - | - |

|
||||

Krown Network
KROWN
|
$0,00005677 | 0.5% | 0.6% | 8.5% | 27.9% | $74 650,88 | - | $5 677 478 |

|
||||

GenLayer
GEN
|
$0,00 | - | - | - | - | - | - | - |

|
||||

Vitreus
WVTRS
|
$0,005062 | 0.0% | 0.9% | 2.8% | 6.9% | $499,15 | - | $3 081 289 |

|
||||

Gonka
GNK
|
$0,1398 | 6.6% | 12.6% | 12.6% | 30.1% | $11 442,40 | - | $60 710 223 |

|
||||

UNIVEX
UVX
|
$0,00 | - | - | - | - | - | - | - |

|
||||

COTI Governance Token
GCOTI
|
$0,0003180 | 0.0% | 6.0% | 56.4% | 28.9% | $2,93 | - | $317 969 |
|
||||

WABA
WABA
|
$0,0004241 | 0.0% | 2.1% | 22.0% | 37.6% | $67,47 | - | $424 108 |

|
||||

Telcoin [OLD]
TEL
|
Acheter
|
$0,001388 | 0.2% | 5.6% | 3.6% | 5.1% | $118 193 | - | $138 840 223 |
|
|||

Sweets
SWEETS
|
$0,00 | - | - | - | - | - | - | - |

|
||||

Orbition Network
OBN
|
$0,00 | - | - | - | - | - | - | - |

|
||||

Jupiter Meta Data Token
JMDT
|
$0,3246 | 0.0% | 72.4% | 72.7% | 73.0% | $1 656,49 | - | $324 612 764 |
|
||||

OroBit
XRB
|
$1,48 | 0.1% | 3.1% | 14.3% | 7.8% | $84 210,06 | - | $742 185 996 |
|
||||

Bloch
BLCH
|
$0,00 | - | - | - | - | - | - | - |

|
||||

BDTCOIN
BDTC
|
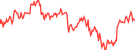
$0,03796 | 0.0% | 35.6% | 95.5% | 99.4% | $440,34 | - | $1 603 175 |
|
||||

ZKcandy
CANDY
|
$0,00 | - | - | - | - | - | - | - |

|
||||

Nyks
NYKS
|
$0,00 | - | - | - | - | - | - | - |

|
||||

Numen
NUMN
|
$0,00 | - | - | - | - | - | - | - |

|
||||

Mandala
KPG
|
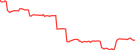
$0,001207 | 0.0% | 7.6% | 11.8% | 28.3% | $1,16 | - | $1 206 608 |
|
||||

HyperCycle
HYPC
|
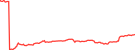
$0,002285 | 0.0% | 7.5% | 19.5% | 43.2% | $2,33 | - | $4 906 324 |
|
||||

Arc
ARC
|
$0,00 | - | - | - | - | - | - | - |

|
||||

Tap Protocol
TAP
|
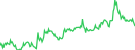
$0,04364 | 0.1% | 0.6% | 7.6% | 4.1% | $7 114,34 | - | $916 519 |
|
||||

AILayer Token
AIL
|
$0,00003387 | 0.0% | 79.2% | 79.8% | 81.4% | $129,11 | - | $33 871,10 |
|
||||

ArchLoot
AL
|
$0,001192 | 0.2% | 2.7% | 3.4% | 16.1% | $46 535,30 | - | $1 182 857 |
|
||||

Tajir
TJR
|
$0,3483 | 0.0% | 1.3% | 1.2% | 2.1% | $2 854,71 | - | $226 418 452 |
|
||||

Xsolla Gas
XLA
|
$0,9607 | 0.1% | 2.3% | 0.0% | 0.0% | $1 031 014 | - | $960 860 851 |

|
||||
Afficher les résultats de 801 à 861 sur 861
Lignes
Plateforme de contrats intelligents Catégories
| Nom | 24 h | Capitalisation boursière |
|---|---|---|
|
Tous Plateforme de contrats intelligents
|
4.7%
|
$1 695 673 691 432
|
|
Couche 1 (L1)
|
4.7%
|
|
|
Proof Of Work Pow
|
4.4%
|
|
|
Proof Of Stake Pos
|
5.9%
|
|
|
Zero Knowledge (ZK)
|
12.2%
|
|
|
Couche 2 (L2)
|
4.6%
|
|
|
Privacy Blockchain
|
4.6%
|
|
|
Layer 0 L0
|
5.4%
|
|
|
Superchain Ecosystem
|
6.4%
|
|
|
Sidechain
|
5.6%
|
|
|
Gaming Blockchains
|
4.4%
|
|
Graphique de la capitalisation boursière des principaux secteurs Plateforme de contrats intelligents
Le graphique ci-dessous présente la capitalisation boursière et la prédominance au sein des Plateforme de contrats intelligents sous-catégories notamment Couche 1 (L1), Proof Of Work Pow, et bien d'autres sur une période donnée.
Graphique des performances des principaux Plateforme de contrats intelligents secteurs
Le graphique ci-dessous présente la performance relative des sous-catégories Plateforme de contrats intelligents au fil du temps, en suivant leurs gains et pertes en termes de pourcentage de capitalisation boursière sur différentes périodes.
Dernières actualités de Plateforme de contrats intelligents


 BTC




 Ou consultez l'application dans les magasins d'applications



